 NERC Data Catalogue Service
1000000
Type of resources
Topics
Keywords
Contact for the resource
Provided by
Years
Formats
Representation types
Update frequencies
Scale
-
Digital hourly mean values of the Geomagnetic field elements from Lerwick, Eskdalemuir, Abinger and Hartland Observatories. Eskdalemuir data are available from 1911, Lerwick from 1926, Hartland from 1957 and all three are available up to yesterday's date. Values from Abinger (1926-1956) are available on request. Most data are definitive, but recent data (within the last 203 years) are provisional and may be corrected in the future. Values of declination (D), horizontal intensity (H) and vertical intensity (Z) are available. The units of declination are degrees. Declination is negative when west of true north. The units of horizontal intensity and vertical intensity are nT (nanotesla). Vertical intensity is positive in the downwards direction. The data from these observatories will not only aid scientific research into rates of change of the magnetic field and increase the accuracy of the BGS Global Geomagnetic Model, but will also provide data to exploration geophysicists engaged in current and future oil exploration.
-
This dataset shows the distribution of Middle Jurassic, Upper Jurassic and Lower Cretaceous lithostratigraphic (UK Offshore Operators Association - UKOOA) units within the UK North Sea graben. The data are based on a subset of released exploration and appraisal wells from within the UK North Sea graben areas. The well data are concentrated in the areas overlying the deep sedimentary basins of the Viking Graben, Central Graben and the Moray Firth Basin, with fewer wells over the adjacent platforms. The UKOOA lithostratigraphic classification has been applied consistently.
-

Digital one-minute values of the Geomagnetic field elements from Lerwick, Eskdalemuir and Hartland Observatories. Data are available from 1979 up to the present day. Most data are definitive, but recent data (within the last 2-3 years) and data between 1979 and 1982 are provisional and may be corrected in the future. The data from these observatories will not only aid scientific research into rates of change of the magnetic field and increase the accuracy of the BGS Global Geomagnetic Model, but will also provide data to exploration geophysicists engaged in current and future oil exploration.
-
UK continental shelf seabed sediment data at 1:1 million scale. This data layer is the BGS contribution to the OneGeology project, providing UK onshore geological data at 1:625 000 scale and UK continental shelf seabed sediment data at 1:1 million scale.
-

This layer of the map-based index (GeoIndex) shows the boundaries of the G-BASE (Geochemical Baseline Survey of the Environment) project mapping areas, which are reported as geochemical atlases. The majority of atlases are for stream sediment, with data on stream water and soil included where available. Separate stream sediment, soil and stream water atlases have been published for Wales. Hard copy atlases are available for Shetland, Orkney, South Orkney and Caithness, Sutherland, Hebrides, Great Glen, East Grampians, Argyll, Southern Scotland, Lake District, NE England, NW England and N Wales and Wales. Digital atlases/map products are available for the Clyde Basin, Central England, London Region and SW England. National digital atlas products are available also.
-
Annual means of the geomagnetic field vector components from observatories around the world, from 1840 to the present day. At present there are about 160 observatories. These data are useful for tracking changes in the magnetic field generated inside the Earth. Data are produced by a number of organisations around the world, including BGS. Data are available in plain text from www.geomag.bgs.ac.uk. This data is connected to other geomagnetic data sets, but can be used without reference to them.
-
This layer of the map based index (GeoIndex) shows where aquifer vulnerability maps are available for England and Wales. These maps identify areas in which the groundwater resources require protection from potentially polluting activities. The maps are designed to be used by planners, developers, consultants and regulatory bodies to ensure that developments conform to the Policy and Practice of the Environment Agency for the protection of Groundwater. The Soil Survey, Land Research Centre and the British Geological Survey were commissioned by the Environment Agency to prepare 53 groundwater vulnerability maps at 1:100,000 scale. Currently we are unable to provide scanned copies of these maps due to Copyright restrictions. Please note that these maps are based on data from the late 1980's and early 1990's. More up-to-date digital data may now be available from the Environment Agency.
-
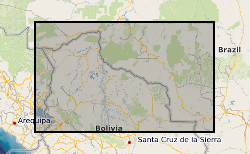
Between 1976 and 1982, the Overseas Directorate of the British Geological Survey, United Kingdom and the Geological Survey of Bolivia, Santa Cruz, carried out a major reconnaissance geological mapping, geochemical sampling and mineral exploration programme of that part of the Precambrian Brazilian Shield lying within eastern Bolivia. Previous geological work had been undertaken in the area, but this was the first time that a systematic and fully integrated survey had been attempted. The Project area is approximately 220,000 square kilometres and regional geochemical samples were collected from 8185 sites producing an overall sampling density of 1 sample per 27 square kilometres. Because of logistic problems it was impossible to sample certain inaccessible areas so the actual sampling density was 1 sample per 16 square kilometres for the 130,000 square kilometres effectively sampled. The geochemical samples were analysed in the Project laboratories in Santa Cruz and in the GEOBOL geochemical laboratories in La Paz. Uranium analyses were carried out by a commercial laboratory in the UK. The results of the Project are incorporated in 21 comprehensive reports in both English and Spanish. Twelve describe the geology, geochemistry and mineral potential of the individual 1:250,000 map areas and the remainder are devoted to the geology and mineral potential of areas of special geological or economic interest. The stream sediments were determined for: Ag, Co, Cu, Fe, Mn, Ni, Pb, Zn, As, U, B, Ba, Be, Cr, La, Li, Mo, Nb, Sn, Sr, Y, and Zr. These results are presented in an atlas as 22 single element 1:1 million scale, classed proportional symbol, point source data maps in which the symbols are overprinted on a simplified geological base map in order to facilitate rapid data interpretation. A 1:4 million scale moving average map based on a 4 x 4 km cell size and a 10 km search radius, printed alongside the symbol map, identifies the major regional variations. Raw data is available from the Geological Survey of Bolivia, Santa Cruz along with copies of the reports.
-

This layer displays the urban areas for which there is an "urban geochemical mapping" report. An integral part of the G-BASE (Geochemical Baseline Survey of the Environment) mapping programme is to map and establish the soil geochemical baselines of urban areas. These data provide unique soil chemical information for the urban environment and are used to; assess the condition of soils within populated areas, identify and quantify human impact on soils in urban areas through comparison with the rural, natural soil geochemical background and Indicate elevated concentrations of potential harmful elements. 27 urban areas which have been sampled by the project to date.These include Glasgow, Nottingham, Ipswich and Cardiff.
-
This is a digital version of the paper based 1:1M scale Offshore Quaternary map, North and South sheets. Customers should be aware that, given the age of the paper based maps, the digital version is not quality assured and BGS can accept no liability for the information held on the digital map. In addition, published 1:250,000 Quaternary maps are available. These contain more detailed subdivision of the Quaternary succession. The original paper based map covers the UK Continental shelf. The paper map is symbolised using lithology and chronology. The lithological boundaries were compiled from the data published in the BGS 1:250,000 Quaternary Geology map series and from revised interpretation of core and borehole data. Core and borehole sites are commonly 5 to 20 km apart, thus the lithological divisions are generalised. The formations and sequences identified by BGS have been grouped into Quaternary age ranges. The geological codes assigned to the digital version of the map have been compiled using the key information held on the paper map. The LEX-ROCK style codes combine the lithology and chronology and have been subject to the standard BGS approval process.