 NERC Data Catalogue Service
50000
Type of resources
Topics
Keywords
Contact for the resource
Provided by
Years
Formats
Representation types
Update frequencies
Scale
-
The DiGMap Plus dataset is a series of GIS layers describing the engineering, geochemical and geophysical properties of geological materials from the base of pedological soil down to c. 3m depth (ie the uppermost c.2m of geology). These deposits display a variable degree of weathering, but still exhibit core characteristics relating to their lithologies. The 'Resistivity' dataset covers England, Scotland and Wales and characterises the material resistivity (based on modelled distributions of clay and moisture content, to 2m depth.
-

The National Soil Parent Material dataset is a GIS describing the geological material from which topsoils and subsoils (A and B horizons) develop (i.e. from the base of pedological soil down to c. 3m). These deposits display a variable degree of weathering, but still exhibit core geological characteristics relating to their lithologies. The dataset covers England, Scotland and Wales and characterises parent material lithology, texture, mineralogy, strength and a range of other soil/parent related properties.
-
Shrink-swell is recognised as the most significant geohazard across Great Britain. This dataset identifies areas of shrink-swell hazard with increased potential due to changing climatic conditions based on forecasts derived from the UKCP09 research project. The dataset has been created at two levels of detail for different climatic scenarios and dates up to 2080. The Basic dataset is an overview at 2Km grid resolution whilst the more detailed Premium dataset is generated at a 50m resolution. The Open versions are simplified versions of the premium versions and are shared via GeoIndex. The premium versions are paid for products. UKCP09 - UK Climate Projections 2009 project
-

Radon is a natural radioactive gas, which enters buildings from the ground. The joint Public Health England (PHE) –British Geological Survey (BGS) digital Indicative Atlas of radon in Great Britain presents an overview of the results of detailed mapping of radon potential, defined as the estimated percentage of homes in an area above the radon Action Level. Exposure to high concentrations increases the risk of lung cancer. PHE (formerly the Health Protection Agency (HPA)) recommends that radon levels should be reduced in homes where the annual average is at or above 200 becquerels per cubic metre (200 Bq m-3). This is termed the Action Level. Public Health England defines radon Affected Areas as those with 1% chance or more of a house having a radon concentration at or above the Action Level of 200 Bq m-3. The Indicative Atlas of radon in Great Britain presents a simplified version of the radon potential for Great Britain with each 1-km grid square being classed according to the highest radon potential found within it, so is indicative rather than definitive. The joint PHE-BGS digital radon potential for Great Britain provides the current definitive map of radon Affected Areas in Great Britain. The Indicative Atlas of radon in Great Britain is published in two documents. The area of England and Wales is published in MILES J.C.H, APPLETON J.D, REES D.M, GREEN B.M.R, ADLAM K.A.M and MYERS, A.H., 2007. Indicative Atlas of Radon in England and Wales. ISBN: 978-0-85951-608-2. 29 pp). The corresponding publication for Scotland is MILES J.C.H, APPLETON J.D, REES D.M, ADLAM K.A.M, GREEN B.M.R, and SCHEIB, C., 2011. Indicative Atlas of Radon in Scotland.).
-
This dataset is a characterisation of the soil and rocks and the potential bulking factor (likely excavated volume increases) at Formation (local to regional) level for Great Britain. The data is categorised into Class, characteristics of similar soils and rocks and Bulking Factor, range or ranges of % bulking. The excavation of rocks or soils is usually accompanied by a change in volume. This change in volume is referred to as ‘bulking’ and the measure of the change is the ‘bulking factor’. The bulking factor is used to estimate the likely excavated volumes that will need to be moved, stored on site, or removed from site. It is envisaged that the 'Engineering Properties: Bulking of soils and rocks' dataset will be of use to companies involved in the estimation of the volume of excavated material for civil engineering operations. These operations may include, but are not limited to, resource estimation, transportation, storage, disposal and the use of excavated materials as engineered fill. It forms part of the DiGMap Plus dataset series of GIS layers which describe the engineering properties of materials from the base of pedological soil down to c. 3m depth (ie the uppermost c.2m of geology). These deposits display a variable degree of weathering, but still exhibit core engineering characteristics relating to their lithologies.
-
This national dataset brings together sixteen national datasets to create a GIS product that provides the information necessary to determine the extent to which the ground is suitable for infiltration sustainable drainage systems (SuDS). It includes derivations of the following datasets: soluble rocks, landslide hazards, groundwater flooding susceptibility, made ground, shallow mining hazards, geological indicators of flooding, depth to water table, superficial thickness, compressible ground, collapsible ground, swelling clays, running sands, predominant flow mechanism, permeability indices and the Environment Agencys source protection zone dataset. All datasets have been reclassified and reattributed (with text descriptions and a score field indicating the suitability of the ground for infiltration) and feature in the end product both as single entities, but also in derived 'screening' maps that combine numerous datasets.
-
**This dataset has been superseded** The newGeoSure Insurance Product (newGIP) provides the potential insurance risk due to natural ground movement. It incorporates the combined effects of the 6 GeoSure hazards on (low-rise) buildings: landslides, shrink-swell clays, soluble rocks, running sands, compressible ground and collapsible deposits. These hazards are evaluated using a series of processes including statistical analyses and expert elicitation techniques to create a derived product that can be used for insurance purposes such as identifying and estimating risk and susceptibility. The evaluated hazards are then linked to a postcode database - the Derived Postcode Database (DPD), which is updated biannually with new releases of Ordnance Survey Code-Point® data (current version used: 2018.1). The newGIP is provided for national coverage across Great Britain (not including the Isle of Man). This product is available in a range of GIS formats including Access (*.dbf), ArcGIS (*.shp) or MapInfo (*.tab). The newGIP is produced for use at 1:50 000 scale providing 50 m ground resolution.
-
The BGS groundwater levels dataset is a gridded interpolation of depth to groundwater. The dataset is a raster grid, with 50 × 50 metre pixels holding values that represent the probable maximum depth, in metres, to the phreatic water table. This represents the likely lowest water level, under natural conditions, in an open well or borehole drilled into the uppermost parts of a rock unit. The dataset has been modelled from topography and hydrology, assuming that surface water and groundwater are hydraulically connected. It has not used observations of groundwater level in wells or boreholes directly, but they have been used to validate its performance.
-
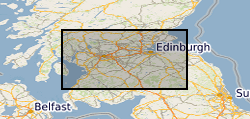
This dataset provides digital spatial information on the location of mineral resources in the central belt of Scotland at a scale of 1:50 000. The term ‘mineral resources’ has a definition under international standards that includes both an economic and geological dimension. These data are based primarily on mapped geology with limited assessment of economics. Therefore, the term ‘mineral resources’ is used here in a broad sense. The dataset allows users to visualise the extent and distribution of mineral resources and to relate them to other forms of land-use (such as urban areas or designated environmentally sensitive areas) or to other factors (such as transport infrastructure and conservation information). The British Geological Survey (BGS) was awarded a grant from the Scottish Government Aggregates Levy Fund in 2007 to provide a comprehensive, relevant and accessible information base to enhance the sustainability of mineral resources for 18 local authorities in the central belt of Scotland. BGS co-funded this project through its Sustainable Mineral Solutions project. This work was completed in March 2008. This dataset comprises the digital GIS files which were produced through this project. In 2020 minor revisions to geometry and attributes were made in in response to minor corrections that were required. The paper maps were not re-released with these data updates. The major elements of minerals information presented are the geological distribution of all mineral resources in the central belt of Scotland. The BGS Mineral Resource data does not determine mineral reserves and therefore does not denote potential areas of extraction. Only onshore, mainland mineral resources are included in the dataset. This dataset has been produced by the collation and interpretation of mineral resource data principally held by the British Geological Survey. The mineral resource data presented are based on the best available information, but are not comprehensive and their quality is variable. The dataset should only be used to show a broad distribution of those mineral resources which may be of current or potential economic interest.
-
Data identifying landscape areas (shown as polygons) attributed with type of mass movement e.g. landslip. The scale of the data is 1:50 000 scale. Onshore coverage is provided for all of England, Wales, Scotland and the Isle of Man. Mass movement describes areas where deposits have moved down slope under gravity to form landslips. These landslips can affect bedrock, superficial or artificial ground. Mass movement deposits are described in the BGS Rock Classification Scheme Volume 4. However the data also includes foundered strata, where ground has collapsed due to subsidence (this is not described in the Rock Classification Scheme). Caution should be exercised with this data; historically BGS has not always recorded mass movement events and due to the dynamic nature of occurrence significant changes may have occurred since the data was released. The data are available in vector format (containing the geometry of each feature linked to a database record describing their attributes) as ESRI shapefiles and are available under BGS data licence.