 NERC Data Catalogue Service
.txt
Type of resources
Topics
Keywords
Contact for the resource
Provided by
Years
Formats
Representation types
Update frequencies
-
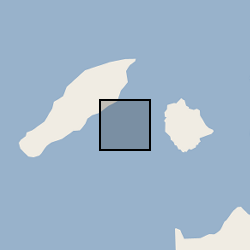
The folders contain the inputs required to run numerical simulations of the Anak Krakatau eruption in 2018, including ERA wind field data, and model input files (.bak). Two sets of simulations were used. The first set of simulations were inversions (see inversion file), which allows input parameters to be estimated through application of numerical model to observations. Multiple inversions were used accounting for different amounts of water entrained at the source (Fractions of 0 - 0.25 in 0.05 intervals). The best fit input parameters were used to run the forward model (see ForwardModel folder), and the results were compared to asses those most representative of observed eruption dynamics (Sim6).
-

This dataset is used and fully described/interpreted in the paper: Passelegue, F. X., N. Brantut, T. M. Mitchell, Fault reactivation by fluid injection: Controls from stress state and injection rate, submitted to Geophys. Res. Lett. Text files contain raw and processed data. Mechanical data are raw. Load needs to corrected (offset) from piston friction, measured at the beginning of each run before the hit point. Axial displacement is converted into sample shortening by correcting the load from machine stiffness, which is equal to 480 kN/mm (calibrated on Mon. 14 Mar. 2016). Data include a set of elastic wave first arrival times, obtained from time of flight measurements using an array of piezoelectric transducers and the cross-correlation method detailed in Brantut (2015) (see reference above). Two separate files correspond to mechanical data from experiments conducted at 50 and 100 MPa confining pressure (""mech_Pc=???MPa.txt""). One file (""sensors.txt"") contains the initial positions of each piezoelectric transducer. Files named ""wave_?_Pc=100MPa.txt"" (?=1,2,3 or 4) contain time series of arrival times during the four injections conducted at Pc=100MPa. Each column consists in the time-of-flight between a given pair of sensors (x->y, where x is the index of source sensor, and y is the index of the receiver sensor, as per their numbering in the ""sensors.txt"" file.) In all the data files, the first column corresponds to a common time basis, in seconds.
-
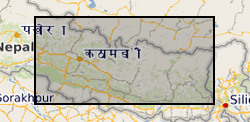
Text file containing the areas (of combined scar, deposition and runnout zones, and estimated scar zones alone) and volumes (for both total and scar areas) of 12,920 Asia Summer Monsoon (ASM) that occurred across central-eastern Nepal in the period 1988 - 2018. Note, landslides were not mapped in the years 2011 and 2012 due to scan line errors in Landsat 7 imagery.
-

Carbon and oxygen isotopic composition of planktic foraminifera spanning the early and middle Eocene succession recovered from borehole 16/28-Sb01. For description of this sedimentary sequence see Haughton et al. 2005. Petroleum Geology: North-West Europe and Global Perspectives, Proceedings of the 6th Petroleum Geology Conference, 1077–1094.
-

Carbon and oxygen isotopic composition of benthic foraminifera spanning the early and middle Eocene succession recovered from borehole 16/28-Sb01. For description of this sedimentary sequence see Haughton et al. 2005. Petroleum Geology: North-West Europe and Global Perspectives, Proceedings of the 6th Petroleum Geology Conference, 1077–1094.
-

This is a point (.txt) file of 12,838 Asia Summer Monsoon (ASM) - triggered landslides that occurred across central-eastern Nepal in the period 1988 - 2018. This inventory includes the landslide locations (x, y coordinates of landslide crests) and geometries, as well as the following landslide attributes, where each attribute was extracted at the position of the landslide crest: elevation (m), slope (o), aspect (o), planform and profile curvature, excess topography (m3), local relief (m), distance to channel (m), distance to road (m), near channel ksn, near channel specific stream power (SSP), average 30-year precipitation, total annual rainfall, peak monthly rainfall, landuse, Permafrost index, geology, and tectonic unit. Note, landslides were not mapped in the years 2011 and 2012 due to scan line errors in the Landsat 7 imagery. These landslides and associated attributes were collected for the purpose of assessing how landslide spatial distributions and susceptibility vary through time.
-

The dataset contains 15 plots and data for time-dependent pressures and temperatures at various locations along a 2582-m-long well and at various simulation times. The realistic scenarios taken into considerations are applied to the Goldeneye depleted reservoir in the North Sea. Pure CO2 is injected into the well and then discharged in the Goldeneye reservoir. Six different scenarios are considered: three different injection durations (linear ramp-up of the inlet mass flow rate from 0 to 33.5 kg/s over 5 minutes, 30 minutes, and 2 hours) and two different upstream temperatures (278.15 K and 283.15 K). Data is currently restricted until publication.
-

This deposit consists of a readme file, which describes the file 'simulationinput.in'. This is a simple text file that contains the information necessary to run any of the ab initio molecular dynamics computer simulations described in the paper that links to this deposit, using the CP2K software package. CP2K is open source. Paper in press: Mineral–water reactions in Earth’s mantle: predictions from Born theory and ab initio molecular dynamics, Fowler, S. J. and Sherman, D. M. and Brodholt, J. P. and Sherman, D. M. Geochimica et Cosmochimica Acta.
-
Text data capturing pore fluid pressures (upstream and downstream), axial stress, axial and radial displacement were conditioned and logged by a high-speed data acquisition unit (NI-DAQ 6341) recording data at 10kHz. Two additional cantilever-type radial strain probes are attached directly to the sample at 90 degrees to each other, with an average output calculated via sqrt[(rA2 + rB2)], where rA and rB are the two radial outputs, to monitor an average radial strain and crack opening displacement.
-
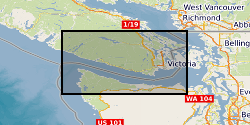
Detections of tremor at a set of template locations over the course of four slow slip events in 2004, 2008, 2009, and 2010. As well as identified bursts of tremor within these windows. The dataset consists of: Detected spikes in the tremor time series Each file contains a list of identified spikes in the inter-component coherence time series. LFE (Low frequency earthquakes) locations The locations of LFEs identified by Bostock, M. G., Royer, A. A., Hearn, E. H., and Peacock, S. M. (2012), Low frequency earthquakes below southern Vancouver Island, Geochem. Geophys. Geosyst., 13, Q11007, doi:10.1029/2012GC004391. Cp values through time 12 files containing time series of inter-component and/or inter-station coherence at a range of LFE locations Further descriptions are available in the README and in the preprint hosted on EarthArxiv: Gombert and Hawthorne, Rapid tremor migration during few minute-long slow earthquakes in Cascadia, 2022, doi: 10.31223/X56623.