 NERC Data Catalogue Service
JPEG
Type of resources
Available actions
Topics
Keywords
Contact for the resource
Provided by
Years
Formats
Representation types
Update frequencies
Service types
Resolution
-
The dataset consists of results of the electrochemical circle fit of the Nyquist plot generated by NOVA software to measure the Charge Transfer Resistance (RCT). Data demonstrates the curve of real and imaginary resistance against charges transmitted in the media of the carbon electrode biosensor. The change in RCT can detect the presence of the targeted antimicrobial resistance (AMR) DNA. The experiments were conducted by immersing the sensor's electrode in different concentrations of the target AMR DNA to determine the limit of detection. Full details about this nonGeographicDataset can be found at https://doi.org/10.5285/6bc69e2a-c771-4538-832e-2f6824b63474
-
Field photographs of rock formations or modern precipitates from the sedimentary environment. Samples were collected throughout the UK. This data was collected between February 2019 and November 2019. This data was collected to better understand the low temperature cycling of Telurium (Te) and Sellenium (Se) in the geological environment. For example, a range of ochre samples were included in this data. Ochres are a modern precipitate commonly found in rivers and streams which flow through geographical areas with a history of mining resources which are rich in sulphides. Iron from the sulphides are leached out and deposited downstream, coating river and stream beds, giving a red, yellow or orange colouration. Ochres can be a sink for trace metals such as Te and Se, therefore studying these environments could be informative from a resource perspective but also from an environmental hazard perspective. This data would be useful for researchers who require reference photographs for similar studies or as an aid for resampling.
-
Photos and videos collected during earthquake damage surveys of the village of Amatrice, central Italy. The earthquake struck on the 24th of August 2016 at 3:36 am local time, a Mw 6.2 earthquake struck a mountainous region of central Italy on the borders between Umbria, Marche, Lazio and Abruzzo. The Earthquake Engineering Field Investigation Team (EEFIT) mission ran from the 4th to the 15th of October 2016. The three main aspects investigated were the ground surface effects caused by the earthquake, the structural damage of masonry buildings and bridges and the effects of the earthquake on reinforced concrete structures and infrastructure.
-
These data comprise collection records of Heliconius butterfly samples collected in the Chocó-Darien ecoregion between the Andes and the Pacific in Ecuador and Colombia, and the Pacific coast of the Darien region of Panama. Samples were collected over five sampling trips between 2014 and 2016. Data were collected for a study of clinal variation across this region in Heliconius erato and Heliconius melpomene, so focus on these two species. However, in most cases all observed Heliconius species were collected. The dataset includes photographs of the wings of most of the specimens, which were used for an analysis of colour and pattern variation. Many of these individuals also have genomic information available for them on the European Nucleotide Archive (ENA) - the data includes ENA accession numbers. Data were collected as part of a NERC fellowship project (NE/K008498/1). Full details about this dataset can be found at https://doi.org/10.5285/cb23c552-caee-4221-bdd3-83b172139ae1
-
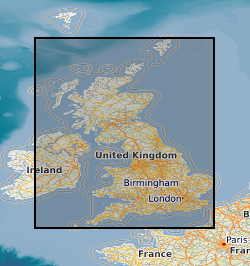
This service is a representation of the Land Classification of Great Britain. The Land Classification is a classification of sets of environmental strata (land classes) to be used as a basis for ecological survey. The classification was originally developed by the Institute of Terrestrial Ecology (ITE) in the late 1970s. The strata were created from the multivariate analysis of 75 environmental variables, including climatic data, topographic data, human geographical features and geology data. The Land Classification has provided a stratification for successive ecological surveys (the Countryside Survey of Great Britain), the results of which have characterised the classes in terms of botanical, zoological and landscape features. Additionally, the Land Classification can be used to stratify a wide range of ecological and biogeographical surveys to improve the efficiency of collection, analysis and presentation of information derived from a sample. There are three layers in this WMS (1) the 1990 version of the Land Classification which contains 32 classes - classifying all 240,000km squares in Great Britain (2) the 1998 version in which the Land Classification was adjusted to 40 classes as a consequence of the need to provide National Estimates for habitats in Scotland in addition to GB (3) the 2007 version in which the Land Classification was adjusted once again, to 45 classes, as a consequence of the need to provide Wales-only estimates in addition to those for Scotland and GB.
-
This web map service provides a 1km resolution gridded coverage of wooded areas in riparian zones (river- or streamsides) across Great Britain. The areas classified as riparian in this dataset are defined by a 50 metre buffer applied to the CEH 1:50000 watercourse network. Wooded areas within this zone are identified as those classified by the Land Cover Map of Great Britain 2007 as either coniferous or deciduous woodland. The data are aggregated to a 1km resolution.
-
This web map service presents modelled estimates of soil pH, carbon concentration (g kg-1), nitrogen concentration (% dry weight soil) and invertebrate density (individuals m-2) at 1km2 resolution across Great Britain. A Generalized Additive Model approach was used with Countryside Survey soil data from 2007 and including climate, atmospheric deposition, habitat, soil and spatial predictors. The models are based on data from Countryside Survey sample locations across Great Britain and are representative of 0-8cm soil depth for invertebrates and 0-15 cm soil depth for other variables. The Countryside Survey looks at a range of physical, chemical and biological properties of the topsoil from a representative sample of habitats across the UK. Loss-on-ignition (LOI) was determined by combustion of 10g dry soil at 375 degrees Celsius for 16 hours; carbon concentration was estimated by multiplying LOI by a factor of 0.55. Soil N concentration was determined using a total elemental analyser. Soil pH was measured using 10g of field moist soil with 25ml de-ionised water giving a ratio of soil to water of 1:2.5 by weight. Soil invertebrates were extracted from cores using a dry Tullgren extraction method and enumerated by microscope
-
This web map service (WMS) is the 1km raster, dominant aggregate class version of the Land Cover Map 2015 (LCM2015) for Great Britain and Northern Ireland. It shows the aggregate habitat class with the highest percentage cover in each 1km x 1km pixel. The 10 aggregate classes are broad groupings of the 21 target classes, based on the Joint Nature Conservation Committee (JNCC) Broad Habitats and which encompass the entire range of UK habitats. The aggregate classes group some of the more specialised classes into more general categories. For example, the five coastal classes in the target class are grouped into a single aggregate coastal class.
-
This web map service (WMS) show Concentration Based Estimated Deposition (CBED) values of sulphur and nitrogen atmospheric deposition for 5x5 kilometre (km) grid squares of the UK averaged over the years 2013 to 2015. The maps show deposition values (kg ha-1 year-1) for oxidised nitrogen (NO2/NO3), reduced nitrogen (NH3/NH4) , non-marine sulphur (SO2/SO4) and base cations (Ca+Mg) . These total deposition values are the sum of four components calculated separately: wet deposition, dry deposition of gases, dry deposition of particulate matter and cloud droplet deposition. Habitat-specific data are provided for (i) moorland/short vegetation everywhere, and (ii) forest everywhere. Additionally, the grid square average over multiple land cover types (i.e. arable, grassland, forest, moorland, urban) is also provided.
-
This web map service (WMS) shows a 1km resolution raster version of the Land Cover Map 2007 for Great Britain. Each 1km pixel represents the dominant target class across the 1km area. The target classes broadly represent Broad Habitats (see below). The dataset is part of a series of data products produced by the Centre for Ecology & Hydrology known as LCM2007. LCM2007 is a parcel-based thematic classification of satellite image data covering the entire United Kingdom. The map updates and upgrades the Land Cover Map of Great Britain (LCMGB) 1990 and LCM2000. Like the earlier 1990 and 2000 products, LCM2007 is derived from a computer classification of satellite scenes obtained mainly from Landsat, IRS and SPOT sensors and also incorporates information derived from other ancillary datasets. LCM2007 was classified using a nomenclature corresponding to the Joint Nature Conservation Committee (JNCC) Broad Habitats, which encompasses the entire range of UK habitats. In addition, it recorded further detail where possible. The series of LCM2007 products includes vector and raster formats, with a number of different versions containing varying levels of detail and at different spatial resolutions.