 NERC Data Catalogue Service
Bacteria
Type of resources
Topics
Keywords
Contact for the resource
Provided by
Years
Formats
Representation types
Update frequencies
-

Two sediment depth cores were collected from the floor of Loch Etive, near Oban, Scotland. Slicing was performed in an anaerobic bag. Samples were taken at 0.5 cm increment between 0 - 2 cm, 1 cm increments between 2 - 10 cm, and at either 2 or 5 cm increments thereafter. Samples were transferred to Newcastle University for DNA extraction. A total of 21 samples were extracted for core 1, and 23 samples extracted for core 2.
-

Two sediment depth cores were collected from a mud sediment patch at the sea floor of the Irish Sea. Cores were collected by the University of Manchester. Cores were sliced at 1 cm intervals from 0 - 10 cm, and at 2 cm intervals thereafter. Slicing was performed in an anaerobic bag. Samples were transferred to Newcastle University for DNA extraction. A total of 21 samples were extracted for core 1, and 23 samples extracted for core 2.
-

Soil depth core collected from the Needle’s Eye site in Dumfries, Scotland. Clear plastic depth core was lowered into a bog within the site, excised, and capped at the top and bottom. Core was sliced at 1 cm intervals at the University of Manchester in an anaerobic bag. A total of 41 samples were generated. Soil samples were returned to Newcastle University.
-
Data from laboratory experiments conducted as part of project NE/K011464/1 (associated with NE/K011626/1) Multiscale Impacts of Cyanobacterial Crusts on Landscape stability. Soils were collected from two sites in eastern Australia and transferred to a laboratory at Griffith University, Queensland for conduct of experiments. Soils were A, a sandy loam, and B a loamy fine sand. Trays 120 mm x 1200 mm x 50 mm were filled with untreated soil that contained a natural population of biota. Soils were either used immediately for experiments (physical soil crust only: PC) or were placed in a greenhouse and spray irrigated until a cyanobacterial crust has grown from the natural biota. Growth was for a period of 5 days (SS), c.30 days (MS2) or c.60 days (MS1). Following the growing period (if applicable) trays were placed in a temperature/humidity controlled room at 35° and 30% humidity until soil moisture (measured 5 mm below the surface) was 5%. Trays were then subject to rainfall simulation. Rainfall intensity of 60 mm hr-1 was used and rainfall was applied for 2 minutes (achieving 2 mm application), 8 minutes (achieving 8 mm application) or 15 minutes (achieving 15 mm application). Following rainfall, trays were returned to the temperature/humidity-controlled room under UV lighting until soil moisture at 5 mm below the surface was 5%. A wind tunnel was then placed on top of each tray in turn and a sequential series of wind velocities (5, 7, 8.5, 10, 12 m s-1) applied each for one minute duration. On each tray the five wind velocities were run without saltation providing a cumulative dust flux. For the highest wind speed, an additional simulation run was conducted with the injection of saltation sands. Three replicates of each rainfall treatment were made. Variables measured include photographs, spectral reflectance, surface roughness, fluorescence, penetrometry, chlorophyll content, extracellular polysaccharide content, Carbon, Nitrogen and splash erosion and particle-size analysis (of wind eroded material). Details of rainfall simulator, growth of cyanobacteria, laser soil surface roughness characterisation and wind tunnel design and deployment in Strong et al., 2016; Bullard et al. 2018, 2019. Bullard, J.E., Ockelford, A., Strong, C.L., Aubault, H. 2018a. Impact of multi-day rainfall events on surface roughness and physical crusting of very fine soils. Geoderma, 313, 181-192. doi: 10.1016/j.geoderma.2017.10.038. Bullard, J.E., Ockelford, A., Strong, C.L., Aubault, H. 2018b. Effects of cyanobacterial soil crusts on surface roughness and splash erosion. Journal of Geophysical Research – Biogeosciences. doi: 10.1029/2018. Strong, C.S., Leys, J.F., Raupach, M.R., Bullard, J.E., Aubault, H.A., Butler, H.J., McTainsh, G.H. 2016. Development and testing of a micro wind tunnel for on-site wind erosion simulations. Environmental Fluid Mechanics, 16, 1065-1083.
-

The <250um fraction of 28 household vacuum dust samples were extracted using high throughput isolation of microbial genomic DNA (21 samples from a national campaign within the UK and 7 samples from Greece, providing samples from two contrasting bioclimatic zones). Both positive and negative reagent controls were included to ensure sterility throughout the processing and sequencing steps, and a randomly selected sample was run in triplicate (DSUK179). These data (raw fastq files: Target_gene 16S and Target_subfragment V4) are available from the European Nucleotide Archive via the study accession PRJEB46920 with individual sample accession numbers ERX6130460 to ERX6130493; https://www.ebi.ac.uk/ena/browser/view/PRJEB46920). A wide range of anthropogenic factors are likely to affect the indoor microbiome and to capture some of this heterogeneity participants were asked to complete a questionnaire. In addition, trace element data were generated using an X-Ray fluorescence spectrometry on the <250um sieved fraction of the household vacuum dust. Sample location data are provided at town/city, Country level. Indoor dust serves as a reservoir for environmental exposure to microbial communities, many of which are benign, some are beneficial, whilst some exhibit pathogenicity. Whilst non-occupational exposure to a range of trace elements and organic contaminants in house dust are a known risk factor for a range of diseases and poor health outcomes, we know far less about the microbial communities associated with our indoor home environments, and their interaction/impacts on human health. Our knowledge of indoor residential bacterial biodiversity, biogeography and their associated drivers are still poorly understood. The data were collected to improve our understanding of the home microbiome.
-
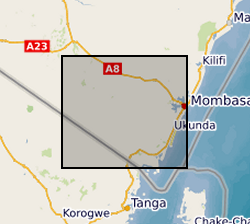
Results of microbial water quality conducted in Kwale County, Kenya from 2015 to 2017 by University of Oxford and Universitat Politecnica de Catalunya as part of the Gro for GooD project (https://upgro.org/consortium/gro-for-good/). Water samples from 101 locations (including 31 open wells, 27 deep boreholes, 21 shallow boreholes with handpumps, 15 covered dug wells with handpumps, and 10 surface water sites. This data set contains results for microbial risk parameters including Escherichia coli, thermotolerant coliforms (TTCs) and tryptophan-like fluorescence (TLF). Most samples also have accompanying data on pH, conductivity, water temperature and turbidity. Duplicate and replicate samples are included and indicated by 'Dup' or 'Rep'. Duplicates samples were collected from the same water points within minutes of each other and laboratory replicates were different aliquots from a single sample. Risk classifications of E. coli and TTC data are based on the World Health Organisation's microbial water quality risk grading scheme. Manufacturer recommended sampling protocols were used. The sampled water points were in regular use and boreholes were flushed with either an electric pump or hand-pumping prior to sample collection. Samples from the open wells were drawn with buckets and rope, which were designated for each site and were rinsed prior to sampling to minimise secondary contamination. Daily field and laboratory blank samples were analysed to confirm no secondary contamination or cross-contamination between sites. For the tryptophan-like fluorescence (TLF) measurement, approximately three litres of unfiltered water were pumped or poured into a stainless-steel container (kept in a black box to prevent ambient light from interfering). The container was cleaned with ethanol and triple-rinsed with sample water prior to each measurement. Measurement was conducted for approximately 3 minutes and the median result was used. The probe and its sensor window were kept clean. Air bubble formation on the sensor window was avoided. For the bacteria sampling, sterile purpose-made bags were used for sample collection and immediately stored in a cooler box with ice-packs. They were transported and processed to begin incubation within two to five hours. Gro for GooD: Groundwater Risk Management for Growth and Development
-

Data from laboratory experiments conducted as part of project NE/K011464/1 (associated with NE/K011626/1) Multiscale Impacts of Cyanobacterial Crusts on Landscape stability. Soils were collected from two sites in eastern Australia and transferred to a laboratory at Griffith University, Queensland for conduct of experiments. Soils were A, a sandy loam, and B a loamy fine sand. Trays 120 mm x 1200 mm x 50 mm were filled with untreated soil that contained a natural population of biota. Soils were either used immediately for experiments (physical soil crust only: PC) or were placed in a greenhouse and spray irrigated until a cyanobacterial crust has grown from the natural biota. Growth was for a period of 5 days (SS), c.30 days (MS2) or c.60 days (MS1). Following the growing period (if applicable) trays were placed in a temperature/humidity controlled room at 35° and 30% humidity until soil moisture (measured 5 mm below the surface) was 5%. Trays were then subject to rainfall simulation. Rainfall intensity of 60 mm hr-1 was used and rainfall was applied for 2 minutes (achieving 2 mm application), 8 minutes (achieving 8 mm application) or 15 minutes (achieving 15 mm application). Following rainfall, trays were returned to the temperature/humidity-controlled room under UV lighting until soil moisture at 5 mm below the surface was 5%. A wind tunnel was then placed on top of each tray in turn and a sequential series of wind velocities (5, 7, 8.5, 10, 12 m s-1) applied each for one minute duration. On each tray the five wind velocities were run without saltation providing a cumulative dust flux. For the highest wind speed, an additional simulation run was conducted with the injection of saltation sands. Three replicates of each rainfall treatment were made. Variables measured include photographs, spectral reflectance, surface roughness, fluorescence, penetrometry, chlorophyll content, extracellular polysaccharide content, Carbon, Nitrogen and splash erosion and particle-size analysis (of wind eroded material). Details of rainfall simulator, growth of cyanobacteria, laser soil surface roughness characterisation and wind tunnel design and deployment in Strong et al., 2016; Bullard et al. 2018, 2019. Bullard, J.E., Ockelford, A., Strong, C.L., Aubault, H. 2018a. Impact of multi-day rainfall events on surface roughness and physical crusting of very fine soils. Geoderma, 313, 181-192. doi: 10.1016/j.geoderma.2017.10.038. Bullard, J.E., Ockelford, A., Strong, C.L., Aubault, H. 2018b. Effects of cyanobacterial soil crusts on surface roughness and splash erosion. Journal of Geophysical Research – Biogeosciences. doi: 10.1029/2018. Strong, C.S., Leys, J.F., Raupach, M.R., Bullard, J.E., Aubault, H.A., Butler, H.J., McTainsh, G.H. 2016. Development and testing of a micro wind tunnel for on-site wind erosion simulations. Environmental Fluid Mechanics, 16, 1065-1083.
-

Data from laboratory experiments conducted as part of project NE/K011464/1 (associated with NE/K011626/1) Multiscale Impacts of Cyanobacterial Crusts on Landscape stability. Soils were collected from eastern Australia and transferred to a laboratory at Griffith University, Queensland for conduct of experiments. Soils were characterised before, during and after simulated rainfall to determine impact of rainfall on soil surface roughness and physical crusting. For two soils (#13 DL Clay_cyano; #14 DL sand_cyano) cyanobacterial crusts were grown on subsamples and these were used to compare the response of soils with, and without, cyanobacterial soil crusts to rainfall treatment. Rainfall intensity of 60 mm hr-1 was used and rainfall was applied for 2 minutes (achieving 2 mm application), 5 minutes (achieving 5 mm application), 2 minutes (achieving 2 mm application) at 24-hour intervals with soils dried at 35°C and 30% humidity between applications in a temperature/humidity-controlled room. Variables measured were soil texture, penetrometry, salinity, splash loss, infiltration, organic matter content, occurrence of ponding, three-dimensional topography. Details of rainfall simulator, growth of cyanobacteria (where soil #13 = Acbc, soil #14 = Bcbc) and all other methods can be found in Bullard et al. 2018, 2019. Bullard, J.E., Ockelford, A., Strong, C.L., Aubault, H. 2018. Impact of multi-day rainfall events onsurface roughness and physical crusting of very fine soils. Geoderma, 313, 181-192. doi: 10.1016/j.geoderma.2017.10.038. Bullard, J.E., Ockelford, A., Strong, C.L., Aubault, H. 2019. Effects of cyanobacterial soil crusts on surface roughness and splash erosion. Journal of Geophysical Research – Biogeosciences. doi: 10.1029/2018 tbc
-

Soil depth core collected from the Needle’s Eye site in Dumfries, Scotland. Clear plastic depth core was lowered into a bog within the site, excised, and capped at the top and bottom. Core was sliced at 1 cm intervals at the University of Manchester in an anaerobic bag. A total of 42 samples were generated. Soil samples were returned to Newcastle University.
-

Data from laboratory experiments conducted as part of project NE/K011464/1 (associated with NE/K011626/1) Multiscale Impacts of Cyanobacterial Crusts on Landscape stability. Soils were collected from two sites in eastern Australia and transferred to a laboratory at Griffith University, Queensland for conduct of experiments. Soils were A, a sandy loam, and B a loamy fine sand. Trays 120 mm x 1200 mm x 50 mm were filled with untreated soil that contained a natural population of biota. Soils were either used immediately for experiments (physical soil crust only: PC) or were placed in a greenhouse and spray irrigated until a cyanobacterial crust has grown from the natural biota. Growth was for a period of 5 days (SS), c.30 days (MS2) or c.60 days (MS1). Following the growing period (if applicable) trays were placed in a temperature/humidity controlled room at 35° and 30% humidity until soil moisture (measured 5 mm below the surface) was 5%. Trays were then subject to rainfall simulation. Rainfall intensity of 60 mm hr-1 was used and rainfall was applied for 2 minutes (achieving 2 mm application), 8 minutes (achieving 8 mm application) or 15 minutes (achieving 15 mm application). Following rainfall, trays were returned to the temperature/humidity-controlled room under UV lighting until soil moisture at 5 mm below the surface was 5%. A wind tunnel was then placed on top of each tray in turn and a sequential series of wind velocities (5, 7, 8.5, 10, 12 m s-1) applied each for one minute duration. On each tray the five wind velocities were run without saltation providing a cumulative dust flux. For the highest wind speed, an additional simulation run was conducted with the injection of saltation sands. Three replicates of each rainfall treatment were made. Variables measured include photographs, spectral reflectance, surface roughness, fluorescence, penetrometry, chlorophyll content, extracellular polysaccharide content, Carbon, Nitrogen and splash erosion and particle-size analysis (of wind eroded material). Details of rainfall simulator, growth of cyanobacteria, laser soil surface roughness characterisation and wind tunnel design and deployment in Strong et al., 2016; Bullard et al. 2018, 2019. Bullard, J.E., Ockelford, A., Strong, C.L., Aubault, H. 2018a. Impact of multi-day rainfall events on surface roughness and physical crusting of very fine soils. Geoderma, 313, 181-192. doi: 10.1016/j.geoderma.2017.10.038. Bullard, J.E., Ockelford, A., Strong, C.L., Aubault, H. 2018b. Effects of cyanobacterial soil crusts on surface roughness and splash erosion. Journal of Geophysical Research – Biogeosciences. doi: 10.1029/2018. Strong, C.S., Leys, J.F., Raupach, M.R., Bullard, J.E., Aubault, H.A., Butler, H.J., McTainsh, G.H. 2016. Development and testing of a micro wind tunnel for on-site wind erosion simulations. Environmental Fluid Mechanics, 16, 1065-1083.