 NERC Data Catalogue Service
Glaciers
Type of resources
Topics
Keywords
Contact for the resource
Provided by
Years
Formats
Representation types
Update frequencies
-
The ESA Glaciers Climate Change Initiative (CCI) dataset consists of data produced by the ESA CCI Glaciers Project. The main objective of the Glaciers_cci project is to contribute to the efforts of creating a globally complete and detailed glacier inventory as requested in action T2.1 by GCOS (2006). This activity has two major parts: One is data creation (glacier outlines) in selected and currently still missing key regions, and the other one is in establishing a more consistent framework for glacier entity identification to enhance the integrity and error characterization of the available data sets. As meltwater from glaciers and ice caps provide a substantial contribution to global sea-level rise, the project will also create two additional products in selected key regions, elevation changes and velocity fields
-

2014 and 2016 time series of automatic weather station (AWS) data (Dataset 1) and (ii) GPS data (Dataset 2) at the location of the SAFIRE research project, Store Glacier, Greenland.
-
These files contain ground penetrating radar (GPR) data collected from the glacier margins and forelands of Falljökull and of Kvíárjökull, south-east Iceland, between 2012 and 2014. The data were collected using a Sensors and Software PulseEKKO Pro GPR system. For each glacier the data are stored in folders that indicate the month and year in which the surveys were conducted. Each GPR profile has a Sensors and Software GPR (.DT1) file, and associated header (.HD) and GPS (.GPS) files. The .HD files (which can be opened as text files) give the parameters and equipment used for each profile. GPS files are not available for some of the profiles collected on Falljökull in April 2013 (due to damage that occurred to the GPS linked with the PulseEKKO Pro system). For these profiles start, finish, and mid profile positions were recorded using differential GPS, and locations of these profiles are instead given by GIS shapefiles in the relevant folders. These datasets have been used in the publications listed below. Further information relating to the data collection methodology can be found therein. Phillips, Emrys; Everest, Jez; Evans, David J.A.; Finlayson, Andrew; Ewertowski, Marek; Guild, Ailsa; Jones, Lee. 2017 Concentrated, ‘pulsed’ axial glacier flow: structural glaciological evidence from Kvíárjökull in SE Iceland. Earth Surface Processes and Landforms, 42 (13). 1901-1922. https://doi.org/10.1002/esp.4145 Phillips, Emrys; Finlayson, Andrew; Bradwell, Tom; Everest, Jez; Jones, Lee. 2014 Structural evolution triggers a dynamic reduction in active glacier length during rapid retreat: evidence from Falljökull, SE Iceland. Journal of Geophysical Research: Earth Surface, 119 (10). 2194-2208. https://doi.org/10.1002/2014JF003165 Phillips, Emrys; Finlayson, Andrew; Jones, Lee. 2013 Fracturing, block-faulting and moulin development associated with progressive collapse and retreat of a polar maritime glacier: Virkisjokul-Falljokull, SE Iceland. Journal of Geophysical Research: Earth Surface, 118 (3). 1545-1561. https://doi.org/10.1002/jgrf.20116 Flett, Verity; Maurice, Louise; Finlayson, Andrew; Black, Andrew; MacDonald, Alan; Everest, Jez; Kirkbride, Martin. 2017. Meltwater flow through a rapidly deglaciating glacier and foreland catchment system: Virkisjökull, SE Iceland. Hydrology Research, 48 (6). 1666-1681. https://doi.org/10.2166/nh.2017.205
-
These high resolution high-oblique time-lapse images were collected in hourly intervals from 5 locations around Helheim glacier in SE Greenland in the summer of 2013. Three cameras (Cameras 1, 2 and 3) were aimed at the calving front ~3.5 km down glacier from the calving front and two cameras (Cameras 4 and 5) were aimed cross-glacier ~3 km up glacier from the calving front. The images are in two stereo groups allowing the extraction of 3D data with significant processing though there are some optical issues that will degrade quality. Links to Published Papers: 1, Extensive Retreat of Greenland Tidewater Glaciers 2000-2010. http://dx.doi.org/10.1657/AAAR0014-049 2, Dynamics of glacier calving at the ungrounded margin of Helheim Glacier South East Greenland. http://dx.doi.org/10.1002/2015JF003531 3, Reverse Glacier motion during Iceberg calving and the cause of Glacial Earthquakes. http://dx.doi.org/10.1126/science.aab0460. 5, A High-resolution Sensor Network for Monitoring Glacier Dynamics. http://dx.doi.org/10.1109/JSEN.2014.2348534. , On the Role of Buoyant Flexure in Glacier Calving. 6, Buoyant Flexure controls summer dynamic mass loss at Helheim Glacier Greenland
-
Data generated using freely-available satellite remote sensing observations from the USGS Earth Resources Observation Science Centre, together with a freely-available ice margin chronology from Dyke et al. (2003) Geological Survey of Canada Open File Report No. 1574. The map is published in the Journal of Maps: http://www.tandfonline.com/doi/full/10.1080/17445647.2014.912036 Published article in 'Nature' Volume 530 Feb 2016 with associated source data. https://dx.doi.org/10.1038/nature16947 Published paper in the Taylor Francis Online Journal with associated data. https://dx.doi.org/10.1080/17445647.2014.912036
-

2014 and 2016 time series of basal multiprobe data (Dataset 1), englacial temperature data (Dataset 2), and englacial tilt data (Dataset 3) measured in boreholes drilled at the location of the SAFIRE research project, Store Glacier, Greenland.
-
There is a report highlighting the approach for model construction and recommendations for any future work. There is an excel file pf processed data including time, centrifuge speed, water pressure, and temperature data. There is a zip folder containing photographs of the models, the instrumentaiton and granular ice used for model construction There is a zip folder containing the raw data.
-
The data consists of observed terminus position and modelled ocean temperature, air temperature and runoff for 10 tidewater glaciers in east Greenland, 1990-2015. The glaciers are (listed from south to north) Mogens 3, Tingmjarmiut 1, AP Bernstorffs Glacier, Helheim Glacier, Kangerdlugssuaq Glacier, Borggraven, Vestfjord Glacier, Daugaard-Jensen Glacier, Waltershausen Glacier, Heinkel Glacier. Values are given as annual means. Glacier terminus positions are derived directly from remote sensing observations. Ocean temperature is based on the mean 200-400m temperature from GLORYS2V3 1/4 deg ocean reanalysis, obtained from the nearest cell of sufficient depth and adjusted to better agree with available in situ observations. Air temperature is based on the May-September mean of monthly temperatures from European Reanalysis (ERA)-Interim global atmospheric reanalysis, while Q is obtained from a 1-km surface melting, retention, and runoff model forced using ERA-Interim reanalysis. These data were compiled to study the relationship between environmental forcings and tidewater glacier retreat in east Greenland, as published by Cowton et al (2018). Funding was provided by the NERC grants NE/K015249/1 and NE/K014609/1.
-
The Randolph Glacier Inventory (RGI 5.0) is a global inventory of glacier outlines. It is supplemental to the Global Land Ice Measurements from Space initiative (GLIMS). Production of the RGI was motivated by the Fifth Assessment Report of the Intergovernmental Panel on Climate Change (IPCC AR5). Future updates will be made to the RGI and the GLIMS Glacier Database in parallel during a transition period. As all these data are incorporated into the GLIMS Glacier Database and as download tools are developed to obtain GLIMS data in the RGI data format, the RGI will evolve into a downloadable subset of GLIMS, offering complete one-time coverage, version control, and a standard set of attributes. The product provided here is a converted raster version of the Randolph Glacier Inventory (RGI 5.0) data, provided by the ESA Climate Change Initiative (CCI) Glaciers project. The CCI Glaciers project is one of a number of contributors to the RGI 5.0 dataset. For more details, and for a complete list of contributors, please see the RGI 5.0 Technical Report in the Documentation section below. The following reference is recommended when citing RGI version 5.0: Arendt, A., A. Bliss, T. Bolch, J.G. Cogley, A.S. Gardner, J.-O. Hagen, R. Hock, M. Huss, G. Kaser, C. Kienholz, W.T. Pfeffer, G. Moholdt, F. Paul, V. Radić, L. Andreassen, S. Bajracharya, N.E. Barrand, M. Beedle, E. Berthier, R. Bhambri, I. Brown, E. Burgess, D. Burgess, F. Cawkwell, T. Chinn, L. Copland, B. Davies, H. De Angelis, E. Dolgova, L. Earl, K. Filbert, R. Forester, A.G. Fountain, H. Frey, B. Giffen, N. Glasser, W.Q. Guo, S. Gurney, W. Hagg, D. Hall, U.K. Haritashya, G. Hartmann, C. Helm, S. Herreid, I. Howat, G. Kapustin, T. Khromova, M. König, J. Kohler, D. Kriegel, S. Kutuzov, I. Lavrentiev, R. LeBris, S.Y. Liu, J. Lund, W. Manley, R. Marti, C. Mayer, E.S. Miles, X. Li, B. Menounos, A. Mercer, N. Mölg, P. Mool, G. Nosenko, A. Negrete, T. Nuimura, C. Nuth, R. Pettersson, A. Racoviteanu, R. Ranzi, P. Rastner, F. Rau, B. Raup, J. Rich, H. Rott, A. Sakai, C. Schneider, Y. Seliverstov, M. Sharp, O. Sigurðsson, C. Stokes, R.G. Way, R. Wheate, S. Winsvold, G. Wolken, F. Wyatt, N. Zheltyhina, 2015, Randolph Glacier Inventory – A Dataset of Global Glacier Outlines: Version 5.0. Global Land Ice Measurements from Space, Boulder Colorado, USA. Digital Media.
-
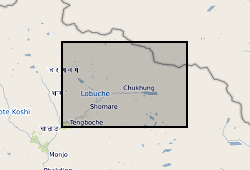
These data consist of a spreadsheet containing 557 ground control points (GCPs) collected in the Everest region of Nepal between October 2015 and October 2016. GCPs were collected using a Leica GS10 differential Global Positioning System (dGPS), post-processed against base station data at Syangboche. These final data have sub-centimetre accuracy (in x, y and z) in all cases. Point positions are heavily concentrated around meltwater ponds on the glacier surface, and prominent features around the glacier margin. These data will be used by PhD students and staff in the School of Geography, University of Leeds, to provide ground control for fine-resolution satellite imagery and Structure-from-Motion surveys to assess mass loss processes on Khumbu Glacier.