 NERC Data Catalogue Service
Groundwater
Type of resources
Topics
Keywords
Contact for the resource
Provided by
Years
Formats
Representation types
Update frequencies
Scale
-

In this study data were collected from viruses in groundwater from urban poor settlements in Arusha, Tanzania, Dodowa (Accra), Ghana, and Kampala, Uganda. The published Open Access paper can be viewed here https://pubs.acs.org/doi/10.1021/acsestwater.0c00306
-

Collection of data from the PhD Thesis 'Development of coupled processes numerical models of tracer, colloid and radionuclide tranpsort in field migration experiments', submitted as part of the RATE HydroFrame WP5. This collection of data includes blank model files in COMSOL Multiphysics and PHREEQC, as described in the PhD thesis. Also included in this data package are different spreadsheets with model outputs from the model files that describe the transport of conservative tracers, colloids and radionuclides in experiments carried out at the Grimsel Test Site, Switzerland as part of the Colloid Radionuclide and Retardation (CRR) and the Colloid Formation and Migration (CFM) experiments (www.grimsel.com).
-
This data was produced to support a project looking at low permeability rocks in sub-Saharan Africa. Multiple boreholes were drilled for the project with geology identified from chippings. Groundwater chemistry was analysed from the resulting boreholes. The data contained within this record is from the CD that accompanies the report: J Davies and J Cobbing, 2002. An assessment of the hydrogeology of the Afram Plains, Eastern Region, Ghana. British Geological Survey Internal Report, CR/02/137N. 66pp http://nora.nerc.ac.uk/id/eprint/505607/1/CR_02_137N.pdf The CD has not been uploaded in full elsewhere.
-
The BGS groundwater levels dataset is a gridded interpolation of depth to groundwater. The dataset is a raster grid, with 50 × 50 metre pixels holding values that represent the probable maximum depth, in metres, to the phreatic water table. This represents the likely lowest water level, under natural conditions, in an open well or borehole drilled into the uppermost parts of a rock unit. The dataset has been modelled from topography and hydrology, assuming that surface water and groundwater are hydraulically connected. It has not used observations of groundwater level in wells or boreholes directly, but they have been used to validate its performance.
-
The data includes field chemistry, major and minor ions (ICP-MS and IC), nutrients (DOC), and tracers (Tritium, CFCs, SF6, δ18O, δ2H, δ13CDIC) collected in Nigeria and Mali in 2010. There is a brief description of the source, depth and completion date of the borehole, type of pump, estimated village population and estimated rainfall. Work funded by UK Department for International Development.
-

This dataset represents the raw reads from sequencing the V4 hyper-variable region of the 16S rRNA gene on an Illumina MiSeq platform. The samples are filtered groundwater samples from 8 boreholes from a sandy-dominated site and a clay-dominated site in Cambodia that show arsenic concentrations above the WHO recommended limit, and were collected in May 2019.
-
The data sets contain the daily record of meters of groundwater columns for 7 Heron logger transducers installed in different boreholes and wells in the study area. Missing data denoted -9999. The Barlog data for atmospheric pressure (Atmospheric Pressure data measured by Heron Barologger for the period of April 2014 to November 2018 at Munje Jabalini.) is also included. "Uncomp.HT.WTR. Above Transducer" corresponds to the actual pressure the dipperLog is measuring. "Barologger Data" corresponds to the Barlog data for atmospheric pressure at Munje Jabalini "Comp.Depth.WTR Below the Datum" is the "Depth below datum" entered in the logger setup less "Comp.HT.WTR. Above Transducer". The data was collected by Albert Folch and Nuria Ferrer (UPC), Mike Lane and Calvince Wara (Rural Focus Ltd). The PI on the Gro for GooD project was Prof. Rob Hope, University of Oxford.
-
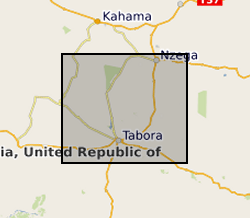
This data was produced to support a project looking at low permeability rocks in sub-Saharan Africa. Multiple boreholes were drilled for the project with geology identified from chippings. Groundwater chemistry was analysed from the resulting boreholes. The data contained within this record is from the CD that accompanies the report: J Davies and B É Ó Dochartaigh. 2002. Low Permeability Rocks In Sub-Saharan Africa. Groundwater development in the Tabora Region, Tanzania. British Geological Survey Internal Report, CR/02/191N. 71pp http://nora.nerc.ac.uk/id/eprint/505608/1/CR_02_191N.pdf The CD has not been uploaded in full elsewhere.
-
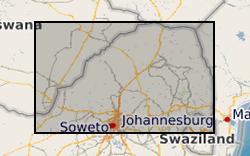
Monthly time-series data of GRACE (Gravity Recovery and Climate Experiment) total terrestrial water storage (TWS), GLDAS (Global Land Data Assimilation System) soil moisture, surface water (surface runoff), snow water storage, and basin-aggregated observations from piezometric data for the Makutapora Basin (Tanzania) and Limpopo Basin (South Africa).
-
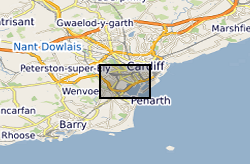
Groundwater temperature data from a shallow urban aquifer in Cardiff, Wales, UK between 2014-2018. Monitoring was undertaken as part of the ‘Cardiff Urban Geo-Observatory’ project . Boreholes are located within the urban area of the City of Cardiff, Wales, UK. The majority of temperature sensors were installed within boreholes that monitor a shallow Quaternary aged sand and gravel aquifer, however the made ground and the Triassic Mercia Mudstone also represented. Temperature sensors installed in 53 boreholes, between depths of 1.5m and 12- m below ground, with measurements every 30 minutes. The dataset comprises of just over 3.5 million temperature measurements. Monitoring was undertaken by the British Geological Survey and was designed to address knowledge gaps of subsurface urban heat island and it use for heat recovery and storage. Metadata Report http://nora.nerc.ac.uk/id/eprint/525332/