 NERC Data Catalogue Service
Hydrogeology
Type of resources
Available actions
Topics
Keywords
Contact for the resource
Provided by
Years
Formats
Representation types
Update frequencies
Service types
Scale
-
Collection of data from the PhD Thesis 'Development of coupled processes numerical models of tracer, colloid and radionuclide tranpsort in field migration experiments', submitted as part of the RATE HydroFrame WP5. This collection of data includes blank model files in COMSOL Multiphysics and PHREEQC, as described in the PhD thesis. Also included in this data package are different spreadsheets with model outputs from the model files that describe the transport of conservative tracers, colloids and radionuclides in experiments carried out at the Grimsel Test Site, Switzerland as part of the Colloid Radionuclide and Retardation (CRR) and the Colloid Formation and Migration (CFM) experiments (www.grimsel.com).
-
Digitised versions of a set of 1:100,000 scale maps of aquifer vulnerability for England and Wales. The dataset identifies the vulnerability to pollution of major and minor aquifers as defined by the Environment Agency, utilising a combination of geological, hydrogeological and soils data. The maps are designed to be used by planners, developers, consultants and regulatory bodies to ensure that developments conform to the Policy and Practice of the Environment Agency for the protection of Groundwater. Please note that these maps are based on data from the late 1980's and early 1990's, more up-to-date digital data may now be available from the Environment Agency. Flat maps may be purchased from the BGS, some sheets are now out of print.
-

Results of Electrical Resistivity Tomography (ERT) conducted in Kwale County, Kenya December 2015 and June 2016 by University of Nairobi and Water Resources Management Authority as part of the Gro for GooD project (https://upgro.org/consortium/gro-for-good/) to characterize the aquifers in the study area. There were eight transects of length 1.2 to 6km, running W-E and NNE-SSW parallel to coastline. ERT data was analysed using RES2D inversion software. Gro for GooD - Groundwater Risk Management for Growth and Development
-

This dataset was generated with a novel process-based stochastic modelling approach to investigate the productivity and sustainability of groundwater abstractions in the Precambrian basement aquifer in Ghana. The statistical distribution of the generated synthetic yield data was found in very good agreement with observed yield data from the same Ghanaian aquifer. The dataset includes more than 40,000 simulated values of maximum allowable yield and corresponding transmissivity values for different realisations of aquifer heterogeneity, net recharge values, and borehole depth. Further details about the dataset and the method of generation and collection can be found in the article by Bianchi et al. (2020) "Investigating the productivity and sustainability of weathered basement aquifers in tropical Africa using numerical simulation and global sensitivity analysis" published in the Water Resources Research journal. This research was supported by the UKRI British Geological Survey NC-ODA grant NE/R000069/1 and NE/M008827/1.
-
The data comprises GIS layers representing the permeability of mass movement deposits for Great Britain. The permeability data has been derived from DiGMap-GB (Digital Geological Map Data of Great Britain), and therefore reflects the scale of DiGMap-GB. For the majority of the Great Britain, the scale is 1:50,000,. The data is updated annually, or after a major new release of DiGMap-GB. The permeability data describes the fresh water flow through mass movement deposits and the ability of a unit to transmit water. Maximum and minimum permeability indices are given for each geological unit to indicate the range in permeability likely to be encountered and the predominant flow mechanism (fracture or intergranular). Neither of the assigned values takes into account the thickness of either the unsaturated or saturated part of the lithostratigraphical unit. The data can be used freely internally, but is licensed for commercial use. It is best displayed using a desktop GIS, and is available in vector format as ESRI shapefiles and MapInfo TAB files.
-

The data comprises four GIS layers representing the permeability of geological deposits for Great Britain (bedrock, superficial, artificial and mass movement deposits). The permeability data has been derived from DiGMap-GB (Digital Geological Map Data of Great Britain), and therefore reflects the scale of DiGMap-GB. For the majority of the Great Britain, the scale is 1:50,000, however in areas where the geology is not mapped to this scale, the next best available scale is used. For bedrock deposits this is 1:250,000 and for superficial deposits this is 1:625:000. Artificial ground and mass movement deposits have not been mapped beyond 1:50,000. The data is updated annually, or after a major new release of DiGMap-GB. The permeability data describes the fresh water flow through geological deposits and the ability of a lithostratigraphical unit to transmit water. Maximum and minimum permeability indices are given for each geological unit to indicate the range in permeability likely to be encountered and the predominant flow mechanism (fracture or intergranular). Neither of the assigned values takes into account the thickness of either the unsaturated or saturated part of the lithostratigraphical unit. The data can be used freely internally, but is licensed for commercial use. It is best displayed using a desktop GIS, and is available in vector format as ESRI shapefiles and MapInfo TAB files.
-

Details of location and geology of wells and springs on Anglesey plus 6 inch County Sheet site maps.
-
The collection consists of records for c.5000 wells and springs in Scotland mostly lodged by drillers in compliance with the Water Act. These include data on well construction, water yields, water levels, water chemistry and well lithology. The collection is organised on the One-Inch Geological Sheet basis. Catalogues for wells in Central Scotland were published between 1963 and 1969. The BGS Single Onshore Borehole Index (SOBI) provides a partial digital index to the records.
-
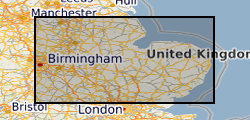
The data comprises GIS layers representing the permeability of artificial deposits for Great Britain. The permeability data has been derived from DiGMap-GB (Digital Geological Map Data of Great Britain), and therefore reflects the scale of DiGMap-GB. For the majority of the Great Britain, the scale is 1:50,000. The data is updated annually, or after a major new release of DiGMap-GB. The permeability data describes the fresh water flow through these deposits and the ability of a lithostratigraphical unit to transmit water. Maximum and minimum permeability indices are given for each geological unit to indicate the range in permeability likely to be encountered and the predominant flow mechanism (fracture or intergranular). Neither of the assigned values takes into account the thickness of either the unsaturated or saturated part of the lithostratigraphical unit. The data can be used freely internally, but is licensed for commercial use. It is best displayed using a desktop GIS, and is available in vector format as ESRI shapefiles and MapInfo TAB files.
-
Gro for GooD VES (Vertical Electrical Soundings) Data, Kwale County, Kenya (NERC grant NE/M008894/1)
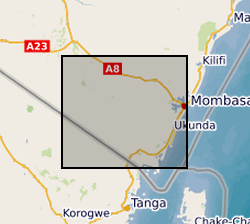
Results of Vertical Electrical Soundings (VES) study conducted in Kwale County, Kenya in July and August 2017 by University of Nairobi and Water Resources Management Authority as part of the Gro for GooD project (https://upgro.org/consortium/gro-for-good/) to determine the existence of deeper aquifers.