 NERC Data Catalogue Service
Hydrology
Type of resources
Topics
Keywords
Contact for the resource
Provided by
Years
Formats
Representation types
Update frequencies
Scale
Resolution
-
In Autumn 1995, the Goddard Distributed Active Archive Center (GDAAC) compiled the Climatology Interdisciplinary Data Collection (CIDC) to facilitate interdisciplinary studies related to climate and global change. This data collection has been produced in collaboration with the Center for Earth Observing and Space Research (CEOSR), Institute for Computational Sciences and Informatics (CSI), and George Mason University. It was designed for the study of global change, seasonal to interannual climate change, and other phenomena that require from one to dozens of interacting parameters. This dataset contains biosphere, hydrology, surface temperature, ozone, greenhouse gases measurements.
-

The following dataset provides climate and cave monitoring data from Cueva de Asiul northern Spain between 2010 and 2014. This data set was initially presented in Smith et al., (2016) Cave monitoring and the potential for palaeoclimate reconstruction from Cueva de Asiul, Cantabria (N. Spain). International Journal of Speleology, 45(1), 1-9. This data set represents the majority of cave monitoring undertaken at this site as part of a NERC funded PhD project (NERC studentship grant NE/I527953/1), data collection either occurred within this single cave site (43°19’0’’N, 3°35’28’’W) or within 1km of the cave in the village of Matienzo. The data set includes high resolution monitoring data for a range of climatic parameters including, cave and external temperature, rainfall direction, amount and oxygen isotope value, soil and cave air pCO2 concentration and carbon isotope value, cave drip rates and oxygen and deuterium isotope values. All data was collected using standard automated logging systems and the data/ samples were analysed either at Lancaster University, UK or at the NERC isotope geosciences laboratory, British Geological Survey, UK. Any missing data is a result of automated logger malfunction and is explained in full in the above cited paper. In combination this data offers a very high resolution, multiyear veiw into hydrological and cave ventilation processes, each of which play a major role in controlling speleothem growth and chemical makeup in Cueva de Asiul. The data set presents the pertinent background monitoring for the accurate interpretation of speleothems from this cave site. Those who may be interested in the data set include cave scientists who wish to implement a monitoring station/understand how climatic parameters influence speleothem development, or those who wish to obtain focused climate data from the Matienzo region between 2010 and 2014. The data set was collected by members of Lancaster University and the Matienzo caving expedition as part of NERC studentship grant NE/I527953/1. All cave monitoring was undertaken with kind permission from Gobierno de Cantabria, Cultura.
-
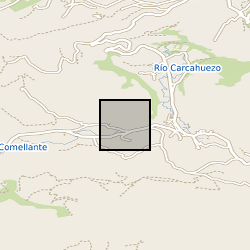
The data set provides climate and cave monitoring data from Cueva de Asiul, Cantabria, northern Spain. This data was initially presented in graphical form in Smith et al., (2015) - Drip water Electrical Conductivity as an indicator of cave ventilation at the event scale. Science of the Total Environment, 532, 517-527. All data was collected from within the cave or within a 1km radius of the cave site (43°19'0"N, 3°35'28"W) using instrumentation set up as part of a PhD project running between January 2010 and January 2014. The data set includes high resolution event based monitoring data for a range of climatic parameters - cave and external temperature, rainfall amount, soil pCO2 cave air pCO2 concentration, cave drip water calcium saturation, drip water electrical conductivity and cave air pressure. This data was analysed at Lancaster University, UK or at the NERC isotope geosciences laboratory, British Geological Survey, UK. Any missing data from this 4 year period is a result of instrument malfunction and is clearly explained within the above cited paper. The electrical conductivity component of the data set offers the first data set of this type form any cave system, using a submerged CTD Diver probe and novel piston flow housing. The rest of the data constitute a part of a larger cave monitoring data set produced during the project using a number of standard automated cave monitoring devices. When combined this data leads us to conclude that cave drip water electrical conductivity is driven primarily by changes in cave air pCO2 at Cueva de Asiul and therefore responds to cave ventilation dynamics, rather than by changes in karst water residence time. Without such extremely high resolution monitoring the impact of cave ventilation on event based changes in drip water electrical conductivity would not have been established for this site. This data set should be of interest to anyone studying similar cave sites, interested in the role of electrical conductivity as a monitoring tool within caves and cave ventilation on speleothem growth dynamics. The data set was collected by members of Lancaster University and the Matienzo caving expedition as part of NERC studentship grant NE/I527953/1. All cave monitoring was undertaken with kind permission from Gobierno de Cantabria, Cultura.
-
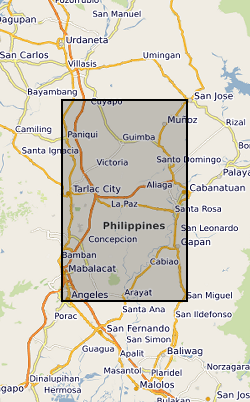
Ensemble of simulated groundwater levels for Central Luzon, Philippines. The simulated time series of data covers the period December 1979 to December 2089 under two Representative Concentration Pathways (RCP2.6 and RCP 8.5). Each ensemble member csv file contains a timeseries of groundwater levels for five locations within the Central Luzon region. The textfile included in the folder shows the coordinates for these locations.
-
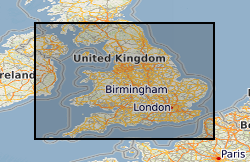
Data on the physical properties (transmissivity, storage coefficient, porosity and permeability) of aquifers in England and Wales. Compiled by BGS staff from paper records of field and laboratory testing held by BGS, the Environment Agency and other organisations. Contains summary data on approximately 20,000 pump tests at over 2000 discrete locations. Raw data may be available on request. The majority of BGS and EA pump test data is included for both major and minor aquifers, but in minor aquifers this is complemented by data on specific yield. Laboratory determinations of porosity and permeability are limited to open file BGS data only. All data subject to similar processing and interpretation, but raw data highly variable.
-
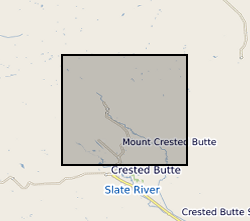
The measurements and data contained here were obtained to study the chemical weathering of sedimentary rocks, and more specifically the oxidation of rock organic carbon and the associated release of CO2. The primary aim was to better understand the production and mobility of the trace element rhenium during weathering, because this element has been proposed as a proxy for rock organic carbon oxidation. The study focused on three Alpine catchments that drain sedimentary rocks, which all experience moderate to high erosion rates where oxidative weathering rates are thought to operate faster. Two catchments were located in Switzerland - the Erlenbach and Vogelbach, and one catchment in Colorado, USA - the East River. To study chemical weathering and the production and mobility of rhenium, a suite of samples were collected to capture the source and products of weathering reactions. These focused on stream and river water, river sediments and weathering profiles collected on sedimentary rocks. The Swiss catchments, water samples were collected from 2011 and 2012 to capture changes in river flow and seasonal changes in hydro-climate. Samples were collected from a gauging station operated by the Swiss Federal Institute for Forest, Snow and Landscape Research - WSL. In the East River, samples were collected from the gauging station operated by the Lawrence Berkeley National Laboratory Watershed Function Scientific Focus Area from 2015 and 2016. Additional samples included snow samples collected from the Erlenbach. All water samples were analysed for their major dissolved ion content by Ion Chromatography. Dissolved rhenium concentrations were determined by High Resolution and Quadrupole Inductively Coupled Plasma Mass Spectrometry. Solid samples were digested and analysed for Re content by ICP-MS. These geochemical measurements were paired with water discharge data to quantify the flux of dissolved elements, using rating curves and flux-weighted average methods, and interpret the hydrological context of ion production and mobility through the landscape. This new data acquisition was funded by a European Research Council Starting Grant to Robert Hilton (ROC-CO2 project, grant 678779) and a Natural Environment Research Council (NERC), UK, Standard Grant (NE/I001719/1). Further details of subsequent data analysis and interpretation can be found in Hilton, R.G., et al., 2021, Concentration-discharge relationships of dissolved rhenium in Alpine catchments reveal its use as a tracer of oxidative weathering, Water Resources Research
-
The data consist of daily maps of volumetric soil moisture predicted by a model based on a network of cosmic-ray neutron sensors (COSMOS-UK), the National River Flow Archive (NRFA) and remotely-sensed data. Maps cover the UK and Ireland at 2-km resolution in the Ordnance Survey National Grid (OSGB) projection. Maps are produced in near-real time, lagging by about one week. Data are available from early 2016 to 2023, on a daily basis. The model was calibrated on a network of cosmic-ray neutron sensors (COSMOS-UK) and remotely-sensed soil moisture data. A key parameter was estimated from the national-scale spatial pattern in the catchment response to rainfall seen in the National River Flow Archive (NRFA) data. Precipitation and humidity data to drive the model came from the Met Office High Resolution Numerical Weather Prediction model (NWP-UKV) which incorporates the C-band rainfall radar network. The maps have a variety of uses in hydrology and elsewhere, for example as inputs to ecosystem models of greenhouse gas exchange, where soil moisture affects numerous processes. The modelling was carried out as part of UK-SCAPE Virtual Survey Lab, and the NERC project "Detection and Attribution of Regional Emissions (DARE-UK)". There are some gaps in the time series of meteorological and remote sensing inputs, and data are unavailable for these days. The NRFA data are only available for Great Britain, so estimates in Ireland and continental Europe will be less accurate. Full details about this dataset can be found at https://doi.org/10.5285/5aa8c5b4-4485-4954-b5c3-18d937a418f7