 NERC Data Catalogue Service
Landsat
Type of resources
Topics
Keywords
Contact for the resource
Provided by
Years
Formats
Representation types
Update frequencies
Scale
-
The Landsat 8 mission was a collaboration between the National Aeronautics and Space Administration (NASA) and the United States Geological Survey (USGS) which ensures the continued availability of Landsat data. This dataset collection contains moderate resolution images of the Earth’s surface in the visible to thermal infrared. Landsat 8 carries two science instruments: the Operational Land Imager (OLI) and the Thermal Infrared Sensor (TIRS). The OLI provides measurements in the visible, near infrared and shortwave infrared including a panchromatic band with 15 m spatial resolution and multispectral bands with 30 m spatial resolution. The TIRS provide a new infrared channel (band 9) for cirrus detection and a new deep blue band (band 1) for coastal monitoring. The TIRS instrument provides measurements at 100 m resolution in two bands in the thermal infrared previously covered by a single wide band. Some data from 2014 is now held by the Centre for Environmental Data Analysis (CEDA).
-
The Landsat Thematic Mapper (TM) sensor was carried onboard Landsats 4 and 5 from July 1982 to May 2012 with a 16-day repeat cycle, referenced to the Worldwide Reference System-2. Very few images were acquired from November 2011 to May 2012. The satellite began decommissioning activities in January 2013. The Thematic Mapper (TM) is an advanced, multispectral scanning, Earth resources sensor designed to achieve higher image resolution, sharper spectral separation, improved geometric fidelity, and greater radiometric accuracy and resolution than the Multispectral Scanner (MSS) sensor. TM data are sensed in seven spectral bands simultaneously. A TM scene has an Instantaneous Field Of View (IFOV) of 30m x 30m in bands 1-5 and 7 while band 6 has an IFOV of 120m x 120m on the ground (band 6 was collected at 120 meters, but was resampled to 30 meters). Band 6 senses thermal (heat) infrared radiation. Landsat can only acquire night scenes in band 6. The approximate scene size is 170 km north-south by 183 km east-west (106 mi by 114 mi).
-
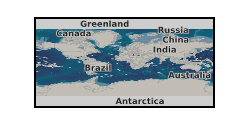
Shapefile map of exposed rock outcrops for the Antarctic continent. The map was produced via a new fully automated methodology for differentiating rock from snow, clouds and sea using Landsat 8 multispectral imagery. Data was merged with the existing Antarctic Digital Database rock outcrop dataset for areas for those areas where Landsat 8 tiles were unavailable (south of 82 deg 40 S).
-
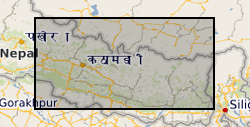
This file contains the point data and areas (in m) of 12,838 monsoon-triggered landslides that occurred during distinct monsoon seasons between 1988 and 2018 across a 45,000 km2 region of central-eastern Nepal.
-
**This dataset has been withdrawn and is no longer avaible from BGS** The database contains satellite images of the UK purchased by the BGS or on its behalf by NERC. It includes data from the Lansdat, SPOT, Radarsat and ERS satellites. The images are stored in proprietary format on various types of magnetic media. The data are currently stored by path-row scene numbers and as mosaics on tapes, CDs and drives. Entire UK is covered by the dataset, however, there are gaps in coverage from individual sensors. Coverage exists for countries (or parts of countries) where work has been carried out.
-
This dataset contains glacier boundaries from 1975 to 2020 and elevation change data from 2000 to 2020 over the Cordilleras Vilcanota, Vilcabamba, and Urubamba, Peru. Glacier boundary data were analysed in Google Earth Engine from the Landsat archive and quantifies rate of change in ice extent over recent decades. Elevation change data were analysed in Google Earth Engine from the ASTER archive and quantifies change in ice thickness over decadal intervals from 2000 to 2020. Data are available as shapefiles (.shp) and GeoTIFFs (.tif). Summary data are available as CSVs (.csv). This work was funded by NERC SPHERES Doctoral Training Partnership (NE/L002574/1) and NERC Newton Fund (PEGASUS) (NE/S013318/1).
-
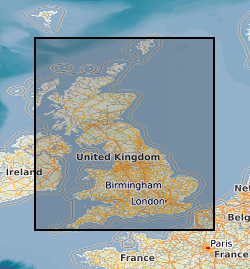
DiGBcoast v1.0, is a new supranational dataset documenting three decades of coastal change across Great Britain mainland (England, Scotland, and Wales) including the isle of Wight and Anglesey. This dataset has been produced using the publicly available optical Landsat-5,8 and Sentinel-2 missions over the period between 1984 to 2022 (38 years). It includes instantaneous waterlines and instantaneous tidally corrected to Mean Sea Level shorelines. DiGBcoast is made available to the public as free and open interactive data to support future coastal research and management across Great Britain.
-
We present here the land cover classification across West Antarctica and the McMurdo Dry Valley produced from Landsat-8 Operational Land Imager (OLI) images of six proglacial regions of Antarctica at 30 m resolution, with an overall accuracy of 77.0 % for proglacial land classes. We conducted this classification using an unsupervised K-means clustering approach, which circumvented the need for training data and was highly effective at picking up key land classes, such as vegetation, water, and different sedimentary surfaces. This work is supported by the Leeds-York-Hull Natural Environment Research Council (NERC) Doctoral Training Partnership (DTP) Panorama under grant NE/S007458/1. The Ministry of Education, Youth and Sports of the Czech Republic project VAN 1/2022 and the Czech Antarctic Foundation funded fieldwork that contributed to part of this work.