 NERC Data Catalogue Service
Mapping
Type of resources
Topics
Keywords
Contact for the resource
Provided by
Years
Formats
Representation types
Update frequencies
Resolution
-
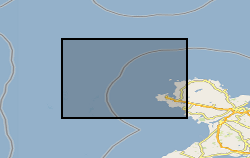
The BGS Seabed Geology 10k: Anglesey digital map portrays the distribution of the different types of bedrock and sediments that are interpreted to represent the dominant geology within to the top 1-2 metres of the seabed to the north-west of Anglesey, at a scale of 1:10 000. It also includes the distribution of the main seabed morphological and geomorphological features (e.g. drumlins, sandwaves) and the principal structural features observed at rockhead (fractures). This digital map is the result of the interpretation of two high-resolution, multibeam echo-sounder (MBES) bathymetry datasets: (i) the Off Skerries HI1420 survey, collected by Net Survey in 2013 as part of the Civil Hydrography Programme (CHP) surveys managed by the Maritime and Coastguard Agency (MCA) for the UK Hydrographic Office; and (ii) the North St George’s Channel candidate Marine Conservation Zone (rMCZ) survey, collected jointly by JNCC and Cefas in 2012 for the Department for Environment, Food and Rural Affairs (Defra). MBES backscatter, physical samples (e.g. grabs, cores, and boreholes), academic papers and previous BGS geological interpretations at broader scales (250k and 50k scales) were used to further inform this geological interpretation. The bedrock is divided into three units: (i) Neoproterozoic to Palaeozoic age metamudstones and metasandstones of the Monian Supergroup; (ii) undifferentiated Lower Palaeozoic age rocks (mudstone, volcaniclastics, siltstone, slate); and (iii) limestone and sandstone of the Carboniferous Limestone Supergroup. The superficial deposits are composed of various types of glacial sediments (e.g. glacial till and morainic deposits) that were deposited underneath and around the margins of the last British-Irish Ice Sheet in the area, and also more recently deposited marine sediments.
-

The BGS Seabed Geology: Offshore East Anglia digital map provides detailed and accurate characterisation of the seabed geology, based on seabed and shallow-subsurface data. This dataset incorporates three complementary map components (Substrate Geology, Structural Geology, and Geomorphology), provided as discrete layers for viewing within a Geographic Information System (GIS). The bedrock geology of the mapped area comprises Cretaceous age Chalk Group sedimentary rocks. These rocks crop out extensively at seabed across the southern and central parts of the dataset forming an extensive bedrock platform and Europe’s largest known offshore chalk reef. This reef has been designated the Cromer Shoal Chalk Beds Marine Conservation Zone (MCZ) owing to the range of unique floral and faunal habitats that it supports. The Chalk Group is covered across the central (partly) and southern parts of the dataset by natural superficial deposits that accreted during the Quaternary. These include preglacial delta bottom-set (Westkapelle Ground Formation) and delta top-set (Yarmouth Roads Formation); and glacial sediments and landforms that were deposited and formed during at least two separate phases of glaciation that inundated parts of the southern North Sea and adjacent East Anglia during the Middle Pleistocene (Anglian / Elsterian) and Late Pleistocene (Late Devensian / Late Weichselian). Collective geological evidence includes extensive areas of out-cropping subglacial till; the presence of largely concealed and infilled over-deepened (>100 m deep) subglacial tunnel valleys, ice-marginal moraines, and a glacially disrupted chalk surface that includes the development of incised meltwater channels, detached and transported glacitectonic bedrock rafts and megablocks. Post-glacial environments from the Late-Pleistocene – Holocene (prior to marine inundation) included fluvial and estuarine deposition, that together with variable infill of late-glacial valleys are included within the Botney Cut Formation. Holocene marine transgression flooded the region, with shallow marine sedimentation active through modern times resulting in the variable cover of unconsolidated marine sediments, as well as the distribution of extensive current-induced bedforms, e.g., sediment banks, sediment waves and fields of mega ripples which are recorded within the Seabed Geomorphology dataset. Each theme is provided as distinct layers for viewing within a Geographic Information System (GIS). The “Substrate Geology” layer shows the distribution of bedrock and unlithified superficial deposits present at the seabed (below a thin veneer of seabed sediments, ‘one-metre principle’ described below) as a series of polygons; The “Structural Geology” layer represents the structural features observed at rockhead as a polylines layer, and “Geomorphology” theme consists of points, polylines, and polygons layers to portray the main seabed morphological and geomorphological features.
-

Lineaments from the Land's End Granite, and immediately adjacent offshore areas, derived from the analysis of LiDAR, bathymetry and aerial photography as detailed in the publication: Yeomans, C.M., Claridge, H., Hudson, A.J.L., Shail, R.K., Willems, C., Eyre, M. and Harker, C. 2023. A single multi-scale and multi-sourced semi-automated lineament detection technique for detailed structural mapping with applications to geothermal energy exploration. Quarterly Journal of Engineering Geology and Hydrogeology, DOI:10.1144/qjegh2022-051. The analysis was undertaken to develop and evaluate methodologies for the assessment of potential fracture-controlled geothermal reservoirs.
-
The data consist of daily maps of volumetric soil moisture predicted by a model based on a network of cosmic-ray neutron sensors (COSMOS-UK), the National River Flow Archive (NRFA) and remotely-sensed data. Maps cover the UK and Ireland at 2-km resolution in the Ordnance Survey National Grid (OSGB) projection. Maps are produced in near-real time, lagging by about one week. Data are available from early 2016 to 2023, on a daily basis. The model was calibrated on a network of cosmic-ray neutron sensors (COSMOS-UK) and remotely-sensed soil moisture data. A key parameter was estimated from the national-scale spatial pattern in the catchment response to rainfall seen in the National River Flow Archive (NRFA) data. Precipitation and humidity data to drive the model came from the Met Office High Resolution Numerical Weather Prediction model (NWP-UKV) which incorporates the C-band rainfall radar network. The maps have a variety of uses in hydrology and elsewhere, for example as inputs to ecosystem models of greenhouse gas exchange, where soil moisture affects numerous processes. The modelling was carried out as part of UK-SCAPE Virtual Survey Lab, and the NERC project "Detection and Attribution of Regional Emissions (DARE-UK)". There are some gaps in the time series of meteorological and remote sensing inputs, and data are unavailable for these days. The NRFA data are only available for Great Britain, so estimates in Ireland and continental Europe will be less accurate. Full details about this dataset can be found at https://doi.org/10.5285/5aa8c5b4-4485-4954-b5c3-18d937a418f7