 NERC Data Catalogue Service
Nitrogen
Type of resources
Topics
Keywords
Contact for the resource
Provided by
Years
Formats
Representation types
Update frequencies
-
Measurements of the nitrogen content of hydrothermal graphite deposits and associated silicate rocks. The samples are of Paleoproterozoic age and allow constraining the behavior of nitrogen in abiotic hydrothermal graphite-forming systems. The results provide context for evaluating the biogenicity of Eoarchean graphite. More details are presented in Stüeken, E.E., Szilas, K. and van Hinsberg, V.J., 2023, Chemical Geology, 617, p.121274.
-

Isotope tracing data for 14C, 15N and 33P tracing between plants and symbiotic fungi in Lycopdiella inundata, Anthoceros and Phaeoceros sp. and Lunularia cruciata. All plants tested and traced in atmospheric CO2 conditions of 440 ppm [CO2] and 800 ppm [CO2]. Datasets includes total mass of plants and soils, Bq in each component of experimental systems and values in Bq and mg where appropriate.
-

Peat properties data and age depth models for 102 peat cores extracted and analysed for the Increased Carbon Accumulation in Arctic Peatlands (ICAAP) project (Grant NE/S001166/1). Peat cores were extracted from 12 peatland sites from four regions of the Arctic: Svalbard (78.09065°N 14.98407°E; 78.98595°N, 11.98246°E; and 78.95872°N, 11.68331°E), Norwegian and Finnish Lapland (70.11876°N, 28.48351°E; 69.80659°N, 27.19732°E; and 69.38787°N, 24.24123°E), Nunavut, Canada (72.655515°N, 78.061646°W; 72.694207°N, 77.864603°W; and 73.13028°N, 80.022987°W), and Quebec, Canada (62.165681°N, 75.915017°W; 62.123168°N, 75.769467°W; and 62.157355°N, 75.607301°W). Data originates from the analysis of Arctic peat cores for changes in rates of lateral expansion and vertical peat accumulation during recent centuries. Specifically, peat cores were analysed for moisture content (%), dry bulk density (g cm-3), C/N content (%), 210Pb activity levels (bq/kg), and 14C radiocarbon age (yr BP).
-

This dataset contains the nitrogen, oxygen, and lithophile element geochemistry of whole rock, and distribution coefficients, and stable isotope fractionation factors for biotite, orthoclase, and plagioclase mineral separates from the Loch Doon Zoned Pluton, Scotland. The samples were collected from the northern limb of the Loch Doon pluton and are petrologically classified as are granodiorites and granites which show geochemical evidence for being a cogenetic zoned pluton. The data were collected over a time period of 2019-2022. These data were collected to investigate elemental partitioning and stable isotope fractionation of nitrogen between biotite, plagioclase, and orthoclase relative to each other and to the system (whole rock) during magmatic differentiation. This project was curiosity-driven science, and the anticipated interest groups are assumed to be the wider research community via scholarship and analytical protocols. These data were collected by an international team of scientists as part of Dr Toby Boocock’s PhD project. The full list of contributors are shown below: Boocock, TJ., Stüeken, ES., König, R., Mikhail, S, The University of St Andrews, UK (performed analysis, acquired samples, interpreted data) Bybee, GM, The University of the Witwatersrand, South Africa (performed analysis) Boyce, AJ, Scottish Universities Environmental Research Centre, UK (performed analysis) Prytulak, J, Durham University, UK (interpreted data) Buisman, I, University of Cambridge, UK (performed analysis)
-

Nitrogen abundances in red shales are shown to be suitable as a biosignature that may be applicable to red beds on Mars. The data set includes organic carbon and nitrogen abundances and isotopic ratios, carbonate carbon and oxygen isotope ratios, and metal abundances. We evaluate potential abiotic effects and discuss diagenetic scenarios that lead to an enrichment of ammonium in clay minerals.
-
Gridded model estimates of nitrate-N stored in the vadose (unsaturated) zone. This dataset presents annual gridded estimates of nitrate stored in the vadose zone for 1900 - 2000 on a 0.5 degree grid (units: kg N/grid cell). Data are supplied as a single netCDF for all years. This data was derived by Ascott et al. (2017). Global models of depth to groundwater table, subsurface porosity and groundwater recharge were used to derive estimates of nitrate travel time in the vadose zone. The travel time was combined with annual estimates of nitrate leaching from the base of the soil zone for 1900 - 2000 to estimate total nitrate stored in the vadose zone. For full details of the dataset derivation, please refer to Ascott et al. (2017). Ascott, M.J., Gooddy, D.C., Wang, L., Stuart, M.E., Lewis, M.A., Ward, R.S. and Binley, A.M. (2017) Global patterns of nitrate storage in the vadose zone. Nature Communications 8(1), 1416.
-

We investigated the physical basis of this weakened trapping using pore scale observations of supercritical CO2 in mixed-wet carbonates. The wetting alteration induced by oil provided CO2-wet surfaces that served as conduits to flow. In situ measurements of contact angles showed that CO2 varied from nonwetting to wetting throughout the pore space, with contact angles ranging 25° <θ< 127°; in contrast, an inert gas, N2, was nonwetting with a smaller range of contact angle 24° <θ< 68 °. Observations of trapped ganglia morphology showed that this wettability allowed CO2 to create large, connected, ganglia by inhabiting small pores in mixed-wet rocks. The connected ganglia persisted after three pore volumes of brine injection, facilitating the desaturation that leads to decreased trapping relative to water-wet systems. This data is associated with this open access publication: Environ. Sci. Technol. 2016, 50, 18, 10282-10290. https://doi.org/10.1021/acs.est.6b03111.
-
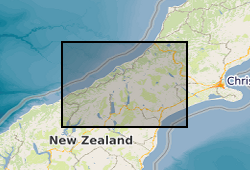
The dataset contains geochemical measurements which quantify the amount and source of carbon in organic matter of sediments from Lake Paringa, New Zealand. Measurements were made on a 6 m sediment core collected in 2015 from the lake bed using a Mackereth corer (PA6m1a). The core was correlated to master core PA1 which has a well-established age-depth model based on accelerator mass spectrometry measurements of the radiocarbon (14C) content of terrestrial macrofossils (Howarth et al., 2016). In addition, soil samples were collected using a soil auger from two elevation transects in westland, New Zealand in 2016 and 2017 (from Mt. Fox and Alex Knob). All sediment samples were freeze dried and ground to homogenise them prior to geochemical analyses. Organic carbon concentration (%) and the stable isotopic composition of organic carbon (δ13C) was measured (Frith et al., 2018) following the removal of carbonate minerals (0.25 M hydrochloric acid for 4 hours at approximately 70 °C) by combustion of sediment at 1,020 °C in a Costech Elemental Analyser coupled via a CONFLO III to a Thermo Scientific Delta V Advantage stable isotope mass spectrometer. Total nitrogen content (N, %) and its isotopic composition (δ15N) was measured by combustion of untreated samples in a Costech Elemental Analyser with a CARBOSORB trap to inhibit large CO2 peaks from affecting measurements. A subset of samples were selected for analysis of the radiocarbon activity (14C, reported as F14C) of bulk organic matter by accelerator mass spectrometry after graphitization. A subset of sediment samples from the lake core and soil samples were selected for the analysis of biomarker abundance and their hydrogen isotope composition. We focused on the extraction of n-alkanes from aliquots of lake sediment (~2 g) using established methods (Wang et al., 2020). These measurements are reported in the dataset as the abundance of n-alkanes (chain lengths C21 to C35) in ug/g of sediment (and sum of chain lengths and ratios - carbon preference index). Finally, the dataset includes outputs of organic matter provenance: modelled elevation and depth, as described in Wang et al., (2020). In the datafile, the sample elevation and depth are provided. The labels for data are as follows. For down core sediment samples from Lake Paringa, they are labelled with the core code (PA6m1), and the sampling interval in centimetres (PA6m1_x). Soil samples from an elevation transect from Mt Fox (MF-YY-a) are labelled with a distinct code for each site (YY) and sub-code for each soil depth (a). Soil samples from an elevation transect of Alex Knob (5.Z.z) are labelled based on sub-site (Z) and soil depth (z).