 NERC Data Catalogue Service
Rainfall
Type of resources
Topics
Keywords
Contact for the resource
Provided by
Years
Formats
Representation types
Update frequencies
Scale
-
Rainfall observations from the Armagh Observatory, founded in 1790 by Archbishop Richard Robinson. As well as astronomical observations various meteorological parameters have been recorded since 1794. If users wish to find data from other areas of work undertaken by the observatory they should visit the Armagh Observatory website.
-
The Quantifying Flood Risk of Extreme Events using Density Forecasts Based on a New Digital Archive and Weather Ensemble Predictions Project is a Natural Environment Research Council (NERC) Flood Risk for Extreme Events (FREE) Research Programme project (Round 1 - NE/E002013/1 - Duration January 2007 - December 2008) led by Dr Patrick McSharry, University of Oxford. The dataset contains a collection of rainfall depth maxima data, dating back to 1860, plus associated description documents and rainfall maps of extreme events across the UK, have been used. All of these products have been digitised from the paper version of the British Rainfall publication, and are now archived at the BADC to enable easy access for future use and the wider community.
-
The Quantifying Flood Risk of Extreme Events using Density Forecasts Based on a New Digital Archive and Weather Ensemble Predictions Project is a Natural Environment Research Council (NERC) Flood Risk for Extreme Events (FREE) Research Programme project (Round 1 - NE/E002013/1 - Duration January 2007 - December 2008) led by Dr Patrick McSharry, University of Oxford. The dataset contains a collection of rainfall depth maxima data, dating back to 1860, plus associated description documents and rainfall maps of extreme events across the UK, have been used. All of these products have been digitised from the paper version of the British Rainfall publication, and are now archived at the BADC to enable easy access for future use and the wider community. Floods in the UK are often caused by heavy rainfall lasting from minutes to weeks. Efficient management and mitigation of flood risk, especially surface water flooding in urban areas, requires accurate and reliable precipitation forecasts as inputs to flood risk models. Houses in flat areas are particularly at risk and meeting the shortage of houses in the south-east requires building on these areas. To estimate the flood hazard risk in order to try to protect these buildings, accurate rainfall predictions are needed. However, the connection between record rainfall and flooding is highly nonlinear, so that rainfall predictions must also say how likely rainfall is at any time - calculating the probability of rainfall. Extreme rainfalls caused devastating floods in Boscastle in 2004 and Lynmouth in 1952, but the causes and pattern of rainfall was different. Therefore, scientists also need to know what pattern of rainfall caused the flooding. This research aims to get good quality predictions of the probability of rainfall by combining advanced methods from statistics, the output from a new supercomputer model of the weather, and a new computer archive of exteme rainfalls going back to 1866 (and up to 1968), provided by a specialist company Hydro-GIS Ltd. It also aims to produce an automatic system for discovering the most likely pattern in the predicted rainfalls. The new prediction system and data will be freely available over the internet for use by the government and universities.
-
The Auchencorth Moss Atmospheric Observatory was setup in 1995 to measure meteorology, trace gases, aerosols and their fluxes. It is (55ᵒ47’36” N, 3°14’41” W) an ombrotrophic peatland with an extensive fetch at an elevation of 270 m, lying 18 km SSW of Edinburgh, UK, and can be categorised as a transitional lowland raised bog. The site is grazed with < 1 sheep ha^-1. During 2000s the site activity has increased and was established in 2006 as EMEP (European Monitoring and Evaluation Program, Level 2/3) supersite for the UK. Long term monitoring is led by NERC CEH with contributions from other organisations/research institutes including Ricardo AEA, BureauVeritas, NPL, the University of Birmingham and University of Edinburgh. In April 2014 the site was awarded WMO GAW regional station (World Meteorological Orgamisation Global Atmospheric Watch). In 2017 the site joined the ICOS network (Integrated Carbon Observation System). Similar measurements are also made at nearby Easter Bush Field site by the same team. The meteorological measurements were initially made to assist with interpretation of the fluxes and as such weren't installed with the intention of providing WMO standard measurements.
-
The site was setup in 1995 to measure meteorology, trace gases, aerosols and their fluxes. It is (55ᵒ47’36” N, 3°14’41” W) an ombrotrophic peatland with an extensive fetch at an elevation of 270 m, lying 18 km SSW of Edinburgh, and can be categorised as a transitional lowland raised bog. The site is grazed with < 1 sheep ha^-1. During 2000s the site activity has increased and was established in 2006 as EMEP (European Monitoring and Evaluation Program, Level 2/3) supersite for the UK. Long term monitoring is led by NERC CEH with contributions from other organisations/research institutes including Ricardo AEA, BureauVeritas, NPL, the University of Birmingham and University of Edinburgh. In April 2014 the site was awarded WMO GAW regional station (World Meteorological Orgamisation Global Atmospheric Watch). In 2017 the site joined the ICOS network (Integrated Carbon Observation System). The meteorological measurements were initially made to assist with interpretation of the fluxes and as such weren't installed with the intention of providing WMO standard measurements but since 2014 we have been moving towards these standards as well as enhancing instrumentation. The dataset includes the following parameters at half hourly intervals, although not every variable is available from 1995 to 2016: -T_upper_Avg - initially used to estimate senisble heat fluxes, fine wire type-E thermocouple. -T_lower_Avg - initially used to estimate senisble heat fluxes, fine wire type-E thermocouple. -T_RHT_Avg - Temperature measured by a Vailsala relative humidity and temperature probe. -RH_RHT_Avg - Relative humidity measured by a Vailsala relative humidity and temperature probe. -P_Avg - atmospheric pressure at the sites elevation. -Tot_Solar_Avg - Total solar radiation measured by a Skye SKS1110. -PAR_Avg - Photosynthetically Averaged Radiation measured by a Skye SKP215. -NetRad_Avg - Net radiation, Kipp & Zonen NrLite. -Rainfall - tipping bucket rainfall. -SoilTavg - Average soil temperature from four type-E thermocouple probes. -Soil Heat Flux - calculated from two measurements of soil heat flux with Hukseflux HFP01 plates, corrected to surface flux using the standard formula. -Cs = Bd(Cd+fSWC.Cw) -SC = DTs.Cs.d/Dtime -SHF = Plate Average + SC -DTs = change in average soil temperature from start to end of measurement period (first and last two minutes); d = plate depth 0.2 m; Bd = soil bulk density, 100 kg m-3; cd = Specific Heat Dry Soil, 840J kg-1 K-1; fSWC = fractional soil water content, measured or 0.9; cw = Specific Capacilty Heat of Water, 4190 J kg-1 K-1; Dtime = measurement period, 1800 s -Soil Moisture - soil water content measured with TDR probes, campbell CS616 -WindSpd (measured) - measured by a Gill R3 then Windmaster sonic anemometer at 3.6 m -WindSpd 10 m - for most of the time period this is estimated from the turbulence measurements and 3.6 m windspeed but from 22/06/2016 a Gill Windsonic 2D anemeometer measures at 10 m -Wind Dir - measured by the sonic anemometer at 3.6 m -snow_depth_Avg - Campbell Scientific SR50A-L Sonic Ranging Sensor -Present Weather - Vaisala FD12P Present Weather Sensor -1 hr Past Weather - Vaisala FD12P Present Weather Sensor -Visibility - Vaisala FD12P Present Weather Sensor -Evaporation - to be estimated from the water-vapout flux measurements For modelling purposes gapfilled (variables with _gf suffixes) times series will be included, they are created by linearly initially interpolating across upto an hours missing data, filling with colocated measurements (adjusted by linear interpolation with the core data), filling with measurements from nearby sites (adjusted by linear interpolation with the core data). Ta_gf P_gf RH_gf Total_Solar_gf Rainfall_gf Windspd 10m_gf Wind Dir_gf
-

Data from laboratory experiments conducted as part of project NE/K011464/1 (associated with NE/K011626/1) Multiscale Impacts of Cyanobacterial Crusts on Landscape stability. Soils were collected from two sites in eastern Australia and transferred to a laboratory at Griffith University, Queensland for conduct of experiments. Soils were A, a sandy loam, and B a loamy fine sand. Trays 120 mm x 1200 mm x 50 mm were filled with untreated soil that contained a natural population of biota. Soils were either used immediately for experiments (physical soil crust only: PC) or were placed in a greenhouse and spray irrigated until a cyanobacterial crust has grown from the natural biota. Growth was for a period of 5 days (SS), c.30 days (MS2) or c.60 days (MS1). Following the growing period (if applicable) trays were placed in a temperature/humidity controlled room at 35° and 30% humidity until soil moisture (measured 5 mm below the surface) was 5%. Trays were then subject to rainfall simulation. Rainfall intensity of 60 mm hr-1 was used and rainfall was applied for 2 minutes (achieving 2 mm application), 8 minutes (achieving 8 mm application) or 15 minutes (achieving 15 mm application). Following rainfall, trays were returned to the temperature/humidity-controlled room under UV lighting until soil moisture at 5 mm below the surface was 5%. A wind tunnel was then placed on top of each tray in turn and a sequential series of wind velocities (5, 7, 8.5, 10, 12 m s-1) applied each for one minute duration. On each tray the five wind velocities were run without saltation providing a cumulative dust flux. For the highest wind speed, an additional simulation run was conducted with the injection of saltation sands. Three replicates of each rainfall treatment were made. Variables measured include photographs, spectral reflectance, surface roughness, fluorescence, penetrometry, chlorophyll content, extracellular polysaccharide content, Carbon, Nitrogen and splash erosion and particle-size analysis (of wind eroded material). Details of rainfall simulator, growth of cyanobacteria, laser soil surface roughness characterisation and wind tunnel design and deployment in Strong et al., 2016; Bullard et al. 2018, 2019. Bullard, J.E., Ockelford, A., Strong, C.L., Aubault, H. 2018a. Impact of multi-day rainfall events on surface roughness and physical crusting of very fine soils. Geoderma, 313, 181-192. doi: 10.1016/j.geoderma.2017.10.038. Bullard, J.E., Ockelford, A., Strong, C.L., Aubault, H. 2018b. Effects of cyanobacterial soil crusts on surface roughness and splash erosion. Journal of Geophysical Research – Biogeosciences. Doi: 10.1029/2018. Strong, C.S., Leys, J.F., Raupach, M.R., Bullard, J.E., Aubault, H.A., Butler, H.J., McTainsh, G.H. 2016. Development and testing of a micro wind tunnel for on-site wind erosion simulations. Environmental Fluid Mechanics, 16, 1065-1083.
-
Gro for GooD Rainfall Data from 22 Manual Rain Gauges, Kwale County, Kenya (NERC grant NE/M008894/1)
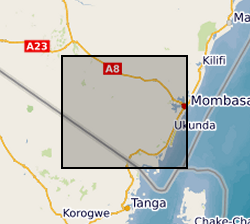
The dataset consist of daily rainfall data for 22 manual rain gauge stations installed by Gro for GooD project within and about the study area. The installed stations covering four river catchments name Ramisi River, Mukurumudzi River, Mtawa River and Mwachema River in Kwale County. The dataset period is from January 2016 to September 2017. Gro for GooD: Groundwater Risk Management for Growth and Development
-

Data from laboratory experiments conducted as part of project NE/K011464/1 (associated with NE/K011626/1) Multiscale Impacts of Cyanobacterial Crusts on Landscape stability. Soils were collected from two sites in eastern Australia and transferred to a laboratory at Griffith University, Queensland for conduct of experiments. Soils were A, a sandy loam, and B a loamy fine sand. Trays 120 mm x 1200 mm x 50 mm were filled with untreated soil that contained a natural population of biota. Soils were either used immediately for experiments (physical soil crust only: PC) or were placed in a greenhouse and spray irrigated until a cyanobacterial crust has grown from the natural biota. Growth was for a period of 5 days (SS), c.30 days (MS2) or c.60 days (MS1). Following the growing period (if applicable) trays were placed in a temperature/humidity controlled room at 35° and 30% humidity until soil moisture (measured 5 mm below the surface) was 5%. Trays were then subject to rainfall simulation. Rainfall intensity of 60 mm hr-1 was used and rainfall was applied for 2 minutes (achieving 2 mm application), 8 minutes (achieving 8 mm application) or 15 minutes (achieving 15 mm application). Following rainfall, trays were returned to the temperature/humidity-controlled room under UV lighting until soil moisture at 5 mm below the surface was 5%. A wind tunnel was then placed on top of each tray in turn and a sequential series of wind velocities (5, 7, 8.5, 10, 12 m s-1) applied each for one minute duration. On each tray the five wind velocities were run without saltation providing a cumulative dust flux. For the highest wind speed, an additional simulation run was conducted with the injection of saltation sands. Three replicates of each rainfall treatment were made. Variables measured include photographs, spectral reflectance, surface roughness, fluorescence, penetrometry, chlorophyll content, extracellular polysaccharide content, Carbon, Nitrogen and splash erosion and particle-size analysis (of wind eroded material). Details of rainfall simulator, growth of cyanobacteria, laser soil surface roughness characterisation and wind tunnel design and deployment in Strong et al., 2016; Bullard et al. 2018, 2019. Bullard, J.E., Ockelford, A., Strong, C.L., Aubault, H. 2018a. Impact of multi-day rainfall events on surface roughness and physical crusting of very fine soils. Geoderma, 313, 181-192. doi: 10.1016/j.geoderma.2017.10.038. Bullard, J.E., Ockelford, A., Strong, C.L., Aubault, H. 2018b. Effects of cyanobacterial soil crusts on surface roughness and splash erosion. Journal of Geophysical Research – Biogeosciences. doi: 10.1029/2018. Strong, C.S., Leys, J.F., Raupach, M.R., Bullard, J.E., Aubault, H.A., Butler, H.J., McTainsh, G.H. 2016. Development and testing of a micro wind tunnel for on-site wind erosion simulations. Environmental Fluid Mechanics, 16, 1065-1083.
-
This dataset contains meteorological observations taken from Ben Nevis and Fort William (1883 -1904). These records were produced as part of the Operation Weather Rescue project. Between 1883 and 1904, detailed meteorological observations were taken at the summit of Ben Nevis (56.80N, 5.00W, 1345m elevation) and in the town of Fort William (56.81N, 5.12W, 13m elevation). Hourly observations include temperature (both wet and dry bulb), rainfall, atmospheric pressure at both locations. Daily observations include minimum and maximum temperatures and rainfall. Additional observations taken at Fort William School during the same period are also included. Units are Celsius for temperature, mm for rainfall and mb for pressure. V2 is the latest version.
-
Data from laboratory experiments conducted as part of project NE/K011464/1 (associated with NE/K011626/1) Multiscale Impacts of Cyanobacterial Crusts on Landscape stability. Soils were collected from two sites in eastern Australia and transferred to a laboratory at Griffith University, Queensland for conduct of experiments. Soils were A, a sandy loam, and B a loamy fine sand. Trays 120 mm x 1200 mm x 50 mm were filled with untreated soil that contained a natural population of biota. Soils were either used immediately for experiments (physical soil crust only: PC) or were placed in a greenhouse and spray irrigated until a cyanobacterial crust has grown from the natural biota. Growth was for a period of 5 days (SS), c.30 days (MS2) or c.60 days (MS1). Following the growing period (if applicable) trays were placed in a temperature/humidity controlled room at 35° and 30% humidity until soil moisture (measured 5 mm below the surface) was 5%. Trays were then subject to rainfall simulation. Rainfall intensity of 60 mm hr-1 was used and rainfall was applied for 2 minutes (achieving 2 mm application), 8 minutes (achieving 8 mm application) or 15 minutes (achieving 15 mm application). Following rainfall, trays were returned to the temperature/humidity-controlled room under UV lighting until soil moisture at 5 mm below the surface was 5%. A wind tunnel was then placed on top of each tray in turn and a sequential series of wind velocities (5, 7, 8.5, 10, 12 m s-1) applied each for one minute duration. On each tray the five wind velocities were run without saltation providing a cumulative dust flux. For the highest wind speed, an additional simulation run was conducted with the injection of saltation sands. Three replicates of each rainfall treatment were made. Variables measured include photographs, spectral reflectance, surface roughness, fluorescence, penetrometry, chlorophyll content, extracellular polysaccharide content, Carbon, Nitrogen and splash erosion and particle-size analysis (of wind eroded material). Details of rainfall simulator, growth of cyanobacteria, laser soil surface roughness characterisation and wind tunnel design and deployment in Strong et al., 2016; Bullard et al. 2018, 2019. Bullard, J.E., Ockelford, A., Strong, C.L., Aubault, H. 2018a. Impact of multi-day rainfall events on surface roughness and physical crusting of very fine soils. Geoderma, 313, 181-192. doi: 10.1016/j.geoderma.2017.10.038. Bullard, J.E., Ockelford, A., Strong, C.L., Aubault, H. 2018b. Effects of cyanobacterial soil crusts on surface roughness and splash erosion. Journal of Geophysical Research – Biogeosciences. doi: 10.1029/2018. Strong, C.S., Leys, J.F., Raupach, M.R., Bullard, J.E., Aubault, H.A., Butler, H.J., McTainsh, G.H. 2016. Development and testing of a micro wind tunnel for on-site wind erosion simulations. Environmental Fluid Mechanics, 16, 1065-1083.