 NERC Data Catalogue Service
Shale
Type of resources
Topics
Keywords
Contact for the resource
Provided by
Years
Formats
Representation types
Update frequencies
Scale
-
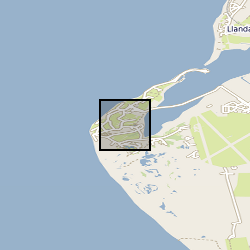
X-ray computed tomography (XCT) scans of four samples of consolidated shale from the Lower Jurassic (C.exaratum subzone) of the Cardigan Bay Basin (Wales, UK). The samples were taken from the Mochras Core, at depths of 789, 810, 812, and 818m (all samples within data measured in metres). Each sample is distinguished by its unique sample identification number (SSK). For each sample, there is a stack of XCT orthoslices (.tiff) files, and for SSK109633, an incomplete Avizo file. Mochras core location (aprox.) 52°48'39.74"N, 4° 8'48.09"W. Mochras Island, west of Llanbedr, Gwynedd, Wales, UK
-

The mechanical data (confining and injection pressures) recorded during Vickers indentation experiments on samples of shale materials. These experiments were conducted on the I12 beamline, Diamond Light Source, Harwell as part of beamtime EE17606-1 between 31/01/18 and 05/02/18.
-

Image data published in AGU paper "Estimation of Capillary Pressure in Unconventional Reservoirs Using Thermodynamic Analysis of Pore Images". The images of unconventional shale rock pores were captured using nano-CT and SEM imaging methods. Images are segmented into fluid (or pore) and rock phases and are stored in RGB format as JPG files. Images were used to produce the plots and data presented in the above referenced paper.
-
This data set contains seismic source parameters (magnitudes, corner frequencies, stress drops and their associated uncertainty) for 94 microseismic events linked to fault reactivation during hydro-fracturing operations in the Horn River Basin (British Columbia). The data presented here were derived from proprietary third party seismic data recorded on 2 arrays of 35 - 15 Hz GEO-OMNI-2400 borehole geophones each. These data were first reported in Adam G Klinger, Maximilian J Werner, Stress drops of hydraulic fracturing induced microseismicity in the Horn River basin: challenges at high frequencies recorded by borehole geophones, Geophysical Journal International, Volume 228, Issue 3, March 2022, Pages 2018–2037, https://doi.org/10.1093/gji/ggab458
-

This dataset contains results from nanoindentation testing of five shale samples from the Horn River Basin (core from wells A100B/94 and D94A/94). The samples are from the following formations: A3 Fort Simpson, A6 Fort Simpson, D1 Muskwa, A16 Otter Park, and A20 Evie. The data is in two sets. Set 1 includes nanoindentation data from all samples, with grids conducted both parallel and perpendicular to the bedding plane. In Set 2, additional chemical analysis of select grids (on samples A3, A6 and A20) was undertaken using SEM/EDS. Both sets include the following tab-separated .txt files: grid_para.txt [Load-displacement-time data for each indent (parallel indentation)]; grid_para_summary.txt [Reduced elastic modulus, hardness and creep modulus for each indent (parallel indentation)]; grid_perp.txt [Load-displacement-time data for each indent (perpendicular indentation)]; grid_perp_summary.txt [Reduced elastic modulus, hardness and creep modulus data for each indent (parallel indentation)]. Set 2 also includes .tif files containing SEM images and EDS chemical analysis of the grids. The data has been filtered to remove indents which show 'pop-in' behaviour or time-displacement curves that do not conform to a logarithmic fit. ACKNOWLEDGMENT - The authors wish to thank the Natural Environment Research Council (NERC) for funding this research through the SHAPE-UK project (grant numbers NE/R018057/1, NE/R017840/1, and NE/R017565/1), which forms Challenge 3 of the UKUH (Unconventional Hydrocarbons in the UK Energy System) programme.
-
The data were produced by Joe Emmings, NERC-funded PhD student at the University of Leicester and British Geological Survey, between 2014 and 2017. Authors of these data: Joe Emmings a, b; Sarah Davies a; Christopher Vane b; Melanie Leng b, c; Vicky Moss-Hayes b; Michael Stephenson b a School of Geography, Geology and the Environment, University of Leicester, University Road, Leicester, LE1 7RH, UK. b British Geological Survey, Keyworth, Nottingham, NG12 5GG, UK. c School of Biosciences, Centre for Environmental Geochemistry, University of Nottingham, Sutton Bonington Campus, Leicestershire LE12 5RD, UK. Data include: 1) A range of photographs from the outcrop Hind Clough and boreholes MHD4 and Cominco S9, sample photographs, thin section scans, microphotographs (transmitted light and scanning electron microscopy) and hand specimen descriptions; 2) The results of 100 analyses from the outcrop Hind Clough and boreholes MHD4 and Cominco S9; x-ray fluorescence major and trace element concentrations, RockEval pyrolysis measurements, x-ray diffraction traces and LECO elemental C and S data. These data were interpreted together with 20 drill-core samples previously acquired from Hind Clough ('HC01' prefix). See http://dx.doi.org/10.5285/c39a32b2-1a30-4426-8389-2fae21ec60ad for further information regarding this drill-core dataset. Acknowledgements: This study was funded by NERC grant NE/L002493/1, a part of the Central England Training Alliance (CENTA). This study also received CASE funding from the BGS. Nick Riley (Carboniferous Ltd) is thanked for sharing his expertise, particularly regarding the field identification of marine faunas. Charlotte Watts is thanked for providing field assistance. Nick Marsh, Tom Knott and Cheryl Haidon are thanked for providing expertise and assistance during inorganic geochemical and mineralogical analyses.
-
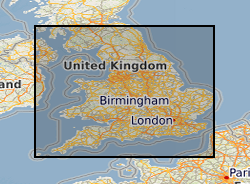
These maps provide an overview, at the national scale, of the spatial relationships between principal aquifers and some of the major shale and clay units in England and Wales. The data comprises a series of occurrence maps shows the distribution of rock units that form the principal aquifers and some major shale and clay units in England and Wales. In addition, a series of separation maps show the vertical separation between pairs of shales or clays and overlying aquifers. If shale gas resources are to be developed in the UK, the implications for groundwater will need to be considered as part of any risk assessment. A step in such an assessment will be to understand and quantify the spatial relationships between the potential shale gas source rocks (including both shales and some clay units) and overlying aquifers. The datasets used to produce the aquifer maps, the shale and clay occurrence maps and the separation maps are available to download for your own use. As with other BGS data sets available for download, this will enable you to work offline to develop your own systems and methodologies using BGS data. The data used to produce the aquifer, shale and clay maps are available below as ESRI GIS and KML files.
-

The dataset describes the results of high pressure experimental measurements of three contrasting 'tight' rocks; a Bowland Shale, a Haynesville shale and Pennant sandstone. The results are tabulated as a csv file, listing experimental parameters, confining pressure, argon gas pore pressure and permeability. complementary measurements of key petrophysical data are provided - bulk modulus of compressibility, porosity TOC and density.
-

The mechanical data (loads, displacements) recorded during double torsion experiments on samples of 6 shale materials and a sandstone. These experiments were conducted on the I12 beamline, Diamond Light Source, Harwell as part of beamtimes EE13824-1 and EE13824-2 between 26/02/17 and 03/03/17. The data were collected using the standard double-torsion technique, with a load cell behind the actuator recording applied force. The method and results are described in detail by Chandler et al, (2018,submitted) "Correlative optical and X-ray imaging of strain evolution during Double Torsion Fracture Toughness measurements in shale" The data was collected with the aim of correlating local deformation around a progressing fracture (through X-Ray and optical imaging) with recorded mechanical data from the loading system. The data was collected by M. Chandler, A-L Fauchille, J. Mecklenburgh, H. K. Kim and L. Ma, and was processed by M. Chandler and R. Rizzo. The complete dataset is present.
-

These data accompany a manuscript, titled: Stream and Slope Weathering Effects on Organic-rich Mudstone Geochemistry and Implications for Hydrocarbon Source Rock Assessment: A Bowland Shale Case Study All files with prefix 'Man_1' relate to this submission. The manuscript was submitted to the journal Chemical Geology in December 2016. Data include: 1) A range of photographs from the outcrop, drill cores, sub-samples, 'weathering grades' and thin section microphotographs from the Bowland Shale; 2) The results of mineralogical (whole rock powder x-ray diffraction; XRD) analyses for 18 subsamples; 3) The results of inorganic geochemical analyses (LECO elemental C and S, x-ray fluorescence major and trace elements) for 18 subsamples; 4) The results of organic geochemical analyses (Rock-Eval pyrolysis, d13Corg) for 20 subsamples; 5) RStudio scripts used to conduct statistical analyses (e.g., Principal Components Analysis) and generation of figures.