 NERC Data Catalogue Service
Simulation
Type of resources
Topics
Keywords
Contact for the resource
Provided by
Years
Formats
Representation types
Update frequencies
-
The folders contain the inputs required to run numerical simulations of the Anak Krakatau eruption in 2018, including ERA wind field data, and model input files (.bak). Two sets of simulations were used. The first set of simulations were inversions (see inversion file), which allows input parameters to be estimated through application of numerical model to observations. Multiple inversions were used accounting for different amounts of water entrained at the source (Fractions of 0 - 0.25 in 0.05 intervals). The best fit input parameters were used to run the forward model (see ForwardModel folder), and the results were compared to asses those most representative of observed eruption dynamics (Sim6).
-

The two earthquake scenario narratives are communications tools created to engage the local population and policy makers in Weinan city. They will be uploaded on the Overseas Development Institute website and be publicly accessible.
-

This dataset contains data from two publications investigating mackinawite FeS in an aqueous environment. The first includes the derivation and validation of the force field parameters necessary to model the system (http://link.springer.com/article/10.1007/s00214-015-1782-8). In the second publication, the force field is employed to predict the structural and dynamical properties of water at the interface with the (001) surface of mackinawite (http://scitation.aip.org/content/aip/journal/jcp/144/9/10.1063/1.4942755).
-

These data show images recorded using a variety of methods of a model system of bacterial metal reduction. In all cases the bacteria grew from a pure culture of Geobacter sulfurreducens, and grew undisturbed on thin films of amorphous Fe oxyhydroxide – ferrihydrite. The different imaging methodologies have highlighted different features of this interaction. AFM shows the surface texture of the bacteria and ferrihydrite films; epifluorescence was used to allow counting of the cells at different time points from 0 to 12 days post inoculation (cell counts available in excel spreadsheet); and confocal imaging allow visualisation of the redox patterns surrounding cells and to identify areas of bioreduced Fe(II) (quantification of Fe(II) available in excel spreadsheet). The following data is included: 1. 9 x AFM images of Geobacter sulfurreducens bacteria growing on ferrihydrite films 2. 5 x epifluorescence images of Geobacter sulfurreducens bacteria growing on ferrihydrite films over time 3. spreadsheet bacterial counts associated with epifluorescence images 4. 7 x confocal images of Geobacter sulfurreducens bacteria growing on ferrihydrite films with redox green staining of appendages 5. 5 x example confocal images of Geobacter sulfurreducens bacteria growing on ferrihydrite films with Fe(II) highlighted by RhoNox-1 6. Spreadsheet of quanitfication of RhoNox intensity against bacteria and Fe co-location Data is presented which shows the formation of precious metal nanoparticles on the surface of geobacter sulfurreducens cells. The images were produced by CryoTEM. Full details of the experiment are available in this publication http://onlinelibrary.wiley.com/doi/10.1002/ppsc.201600073/full 7. Powerpoint presentation of TEM images of precious metal nanoparticles formed on the surface of Geobacter cells
-

This excel spreadsheet contains P-wave and S-wave velocity and attenuation data calculated with a novel rock physics model for hydrate bearing sediments. The model has been published in: Marín-Moreno, H., S. K. Sahoo, and A. I. Best (2017), Theoretical modeling insights into elastic wave attenuation mechanisms in marine sediments with pore-filling methane hydrate, Journal of Geophysical Research: Solid Earth, 122(3), 1835-1847, doi:10.1002/2016JB013577.
-
General circulation model (HadCM3) output of the study by Matero et al. (2017) “The 8.2 ka cooling event caused by Laurentide ice saddle collapse. Data has been processed into netCDF4 - timeseries, and includes the following variables at model resolution: ocean temperature, ocean salinity, precipitation, air temperature at 2m height, depth of the oceanic mixed layer, sea ice concentration and meridional overturning circulation strength. The atmosphere component of the model has a horizontal resolution of 2.5° x 3.75° with 19 unevenly spaced vertical layers. The ocean component has a horizontal resolution of 1.25° x 1.25° with 20 unevenly spaced vertical layers. For more information see published paper, https://doi.org/10.1016/j.epsl.2017.06.011
-
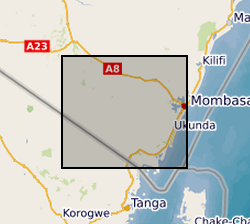
The download .rar file contains a groundwater model of the coastal aquifer in Kwale County, Kenya (ModelMuse Text File) produced by Dr Nuria Ferrer and Dr Albert Folch at the Universitat Politècnica de Catalunya. The model can be used to explore future climate and groundwater abstraction scenarios to provide management recommendations. The download does not include proprietary abstraction data from industry project partners, thus running the model provided here will not reproduce published research findings. The file named”np67IH.bhd” are the initial heads file required to run the model.
-
Microgravity data collected at Uturuncu Volcano located in the Altiplano-Puna Volcanic Complex, central Andes, in November 2022. Raw data collected along a survey line spanning from Laguna Colorada to Laguna Verde using a field gravimeter. All data have been preprocessed and corrected for tidal and drift effects. Data are reported with respect to reference station UBAS located to the west of Uturuncu near the Laguna Colorada.
-
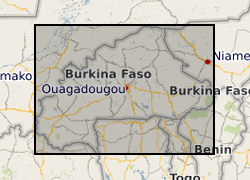
This dataset consists of reconstructions of daily groundwater levels for eight boreholes in Burkina Faso. Data for each borehole is provided in an individual csv file, with reconstructed groundwater level time series reported in metres above sea level (GWL, mASL). The groundwater level reconstructions were derived in 2019 as a part of the BRAVE project (NE/M008827/1 and NE/M008983/1) to develop an improved understanding of temporal variability in groundwater levels in sub-Saharan Africa. The reconstructions were derived using the lumped conceptual groundwater model AquiMod. Observed groundwater level time series for the eight boreholes were modelled using AquiMod, and the calibrated models were used with historic precipitation and potential evapotranspiration data to derive the reconstructions. The length of the time series of reconstructed groundwater levels varies between the boreholes due to differences in the length of the precipitation time series used to derive the reconstructions. Full details of this dataset are reported by Ascott et al. (2020). Ascott, M.J., Macdonald, D.M.J., Black, E., Verhoef, A., Nakohoun, P., Tirogo, J., Sandwidi, W.J.P., Bliefernicht, J., Sorensen, J.P.R., Bossa, A.Y., 2020. In Situ Observations and Lumped Parameter Model Reconstructions Reveal Intra-Annual to Multidecadal Variability in Groundwater Levels in Sub-Saharan Africa. Water Resour. Res., 56(12): e2020WR028056. DOI:https://doi.org/10.1029/2020WR028056
-

Numerical models of mass flows and tsunamis that they generated with their entrance in the sea. The mass flows propagate in the Sciara del Fuoco of Stromboli. The mass flows are not real events, but are rather used as a sensitivity analysis to examine tsunamigenic potential of mass flows of landslides and pyroclastic flows of different durations, volumes and coherence. The data was generated with the two fluid version of the Volcflow model. The material includes tsunami height measurements (plotted as well as raw data) for each run recorded by virtual gauges located around the island (map of gauges included), maximum wave height data in the area around the island and at the shores, a video visualisation of the mass flows and resultant tsunami waves, and a figure of the final deposit from each modelled mass flow. The numerical model simulations were carried out by Symeon Makris. The Volcflow code is not included in the submitted material but it is open source and can be downloaded here: https://lmv.uca.fr/volcflow/