 NERC Data Catalogue Service
Topography
Type of resources
Topics
Keywords
Contact for the resource
Provided by
Years
Formats
Update frequencies
Scale
-
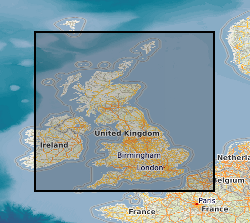
This dataset comprises 2 collections of maps. The facsmile collection contains all the marginalia information from the original map as well as the map itself, while the georectified collection contains just the map with an associated index for locating them. Each collection comprises approximately 101 000 monochrome images at 6-inch (1:10560) scale. Each image is supplied in .tiff format with appropriate ArcView and MapInfo world files, and shows the topography for all areas of England, Wales and Scotland as either quarter or, in some cases, full sheets. The images will cover the approximate epochs 1880's, 1900's, 1910's, 1920's and 1930's, but note that coverage is not countrywide for each epoch. The data was purchased by BGS from Sitescope, who obtained it from three sources - Royal Geographical Society, Trinity College Dublin and the Ordnance Survey. The data is for internal use by BGS staff on projects, and is available via a customised application created for the network GDI enabling users to search for and load the maps of their choice. The dataset will have many uses across all the geoscientific disciplines across which BGS operates, and should be viewed as a valuable addition to the BGS archive. There has been a considerable amount of work done during 2005, 2006 and 2007 to improve the accuracy of the OS Historic Map Collection. All maps should now be located to +- 50m or better. This is the best that can be achieved cost effectively. There are a number of reasons why the maps are inaccurate. Firstly, the original maps are paper and many are over 100 years old. They have not been stored in perfect condition. The paper has become distorted to varying degrees over time. The maps were therefore not accurate before scanning. Secondly, different generations of maps will have used different surveying methods and different spatial referencing systems. The same geographical object will not necessarily be in the same spatial location on subsequent editions. Thirdly, we are discussing maps, not plans. There will be cartographic generalisations which will affect the spatial representation and location of geographic objects. Finally, the georectification was not done in BGS but by the company from whom we purchased the maps. The company no longer exists. We do not know the methodology used for georectification.
-
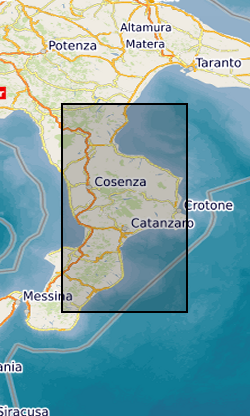
River elevation and catchment area data for major rivers in Calabria, Italy (one river profile in each file). Data were extracted from 1 arc second SRTM (Shuttle Radar Topography Mission) Digital Elevation Models using the Arc GIS hydrology toolbox between October 2015 and October 2019. These river profiles were acquired for fluvial inversion to calculate rock uplift in Calabria.
-
A coastline of Kalaallit Nunaat/ Greenland covering all land and islands, produced in 2017 for the BAS map ''Greenland and the European Arctic''. The dataset was produced by extracting the land mask from the Greenland BedMachine dataset and manually editing anomalous data. Some missing islands were added and glacier fronts were updated using 2017 satellite imagery. The dataset can be used for cartography, analysis and as a mask, amongst other uses. At very large scales, the data will appear angular due to the nature of being extracted from a raster with 150 m cell size, but the dataset should be suitable for use at most scales and can be edited by the user to exclude very small islands if required. The projection of the dataset is WGS 84 NSIDC Sea Ice Polar Stereographic North, EPSG 3413. The dataset does not promise to cover every island and coastlines were digitised using the data creator''s interpretation of the landforms from the images.
-
Radio-echo sounding (RES) data was collected between 4 and 11 December 2012, using the British Antarctic Survey Deep-Look Radio-Echo Sounder (DELORES). From this dataset a digital elevation model (DEM) for Starbuck Glacier was created. The data consists of grids relating to ice-thickness and bedrock elevation for the glacier as well as the RES data.
-
Complete Antarctic contour dataset at 1000 m intervals, split and labelled according to whether the contour represents an ice or rock surface. Data have been prepared from various map and remotely sensed datasets. This dataset has been generalised from the high resolution contour dataset. Further information regarding source and source data can be found within the high resolution attribute table. Certain inconsistencies and errors are currently known and a comprehensive update is planned for version 7.3.
-
These two files (.csv) provide independent methods of quantifying subglacial roughness in Greenland, both calculated from radio-echo sounding (or ice penetrating radar) data collected by the Operation Ice Bridge programme using CReSIS instrumentation. They are an output of the Basal Properties of Greenland (BPOG) project (http://bpog.blogs.ilrt.org/), with funding from NERC grant NE/M000869/1. Roughness here, and in the wider literature, is defined as the variation in bed elevation (in the vertical) at the ice-bed interface, over a given length-scale. These two metrics calculate/quantify this variation in different ways: one shows topographic-scale roughness, calculated from the variation in along-track topography (bed elevation measurements derived from the radar pulse); and the other shows scattering-derived roughness, calculated from quantifying characteristics of each bed-echo (the return from the radar pulse at the ice-bed interface).